explain how to sketch a graph of the function f(x)=x³ + 2x² - 8x. be sure to include end - behavior, zeroes…
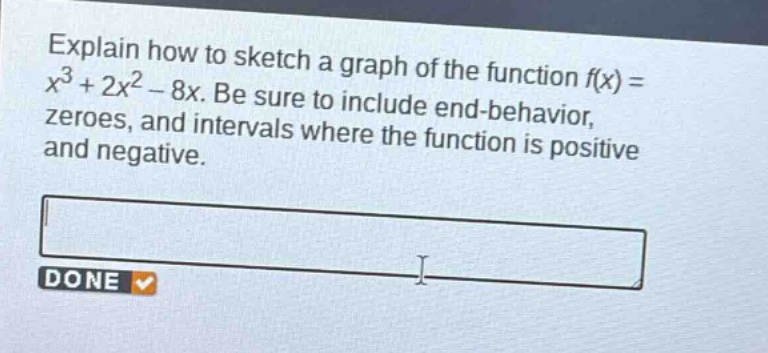
explain how to sketch a graph of the function f(x)=x³ + 2x² - 8x. be sure to include end - behavior, zeroes, and intervals where the function is positive and negative.
Answer
Explanation:
Step1: Find the zeros
Set $f(x)=x^{3}+2x^{2}-8x = 0$. Factor out $x$ first: $x(x^{2}+2x - 8)=0$. Then factor the quadratic: $x(x + 4)(x - 2)=0$. So the zeros are $x = 0$, $x=-4$, $x = 2$.
Step2: Determine end - behavior
Since the leading term is $x^{3}$ (odd - degree and positive leading coefficient), as $x\to-\infty$, $y\to-\infty$ and as $x\to+\infty$, $y\to+\infty$.
Step3: Find intervals of positive and negative
Use test points in the intervals $(-\infty,-4)$, $(-4,0)$, $(0,2)$ and $(2,\infty)$. For $x=-5$ in $(-\infty,-4)$, $f(-5)=(-5)(-5 + 4)(-5 - 2)=(-5)(-1)(-7)=-35<0$. For $x=-1$ in $(-4,0)$, $f(-1)=(-1)(-1 + 4)(-1 - 2)=(-1)(3)(-3)=9>0$. For $x = 1$ in $(0,2)$, $f(1)=(1)(1 + 4)(1 - 2)=(1)(5)(-1)=-5<0$. For $x = 3$ in $(2,\infty)$, $f(3)=(3)(3 + 4)(3 - 2)=(3)(7)(1)=21>0$. So the function is negative on $(-\infty,-4)\cup(0,2)$ and positive on $(-4,0)\cup(2,\infty)$.
Answer:
To sketch the graph: Mark the zeros at $x=-4$, $x = 0$ and $x = 2$. The graph goes down to the left and up to the right. It is below the $x$-axis on $(-\infty,-4)\cup(0,2)$ and above the $x$-axis on $(-4,0)\cup(2,\infty)$.