the figure shows the graph of a function f. the zero and extrema for f are labeled, and the point of…
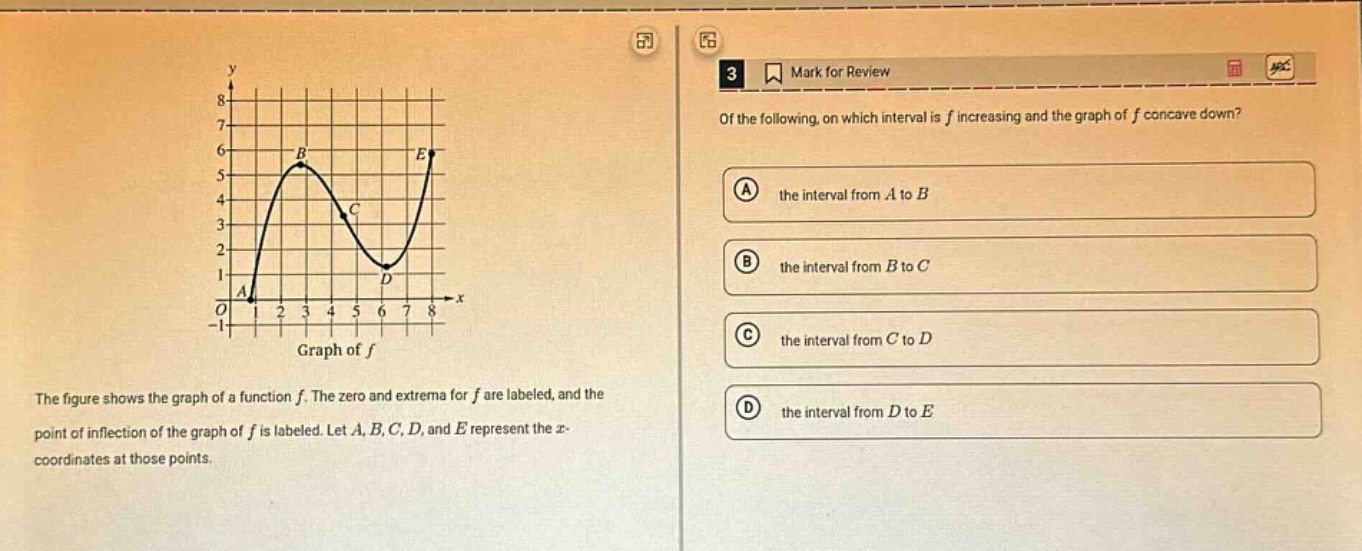
the figure shows the graph of a function f. the zero and extrema for f are labeled, and the point of inflection of the graph of f is labeled. let a, b, c, d, and e represent the x - coordinates at those points. of the following, on which interval is f increasing and the graph of f concave down? a the interval from a to b b the interval from b to c c the interval from c to d d the interval from d to e
Answer
Explanation:
Step1: Recall function - increasing and concavity rules
A function (y = f(x)) is increasing when (f^{\prime}(x)>0) (the slope of the tangent line is positive), and the graph of (y = f(x)) is concave - down when (f^{\prime\prime}(x)<0) (the first - derivative (f^{\prime}(x)) is decreasing).
Step2: Analyze the interval from (A) to (B)
On the interval from (A) to (B), the function is increasing (the (y) - values are getting larger as (x) increases) and the graph is concave - down (the curve opens downwards). The slope of the tangent line is positive and the rate of change of the slope is negative.
Step3: Analyze the interval from (B) to (C)
On the interval from (B) to (C), the function is decreasing ((f^{\prime}(x)<0)) since the (y) - values are getting smaller as (x) increases.
Step4: Analyze the interval from (C) to (D)
On the interval from (C) to (D), the function is decreasing ((f^{\prime}(x)<0)) as the (y) - values are getting smaller as (x) increases.
Step5: Analyze the interval from (D) to (E)
On the interval from (D) to (E), the function is increasing ((f^{\prime}(x)>0)), but the graph is concave - up ((f^{\prime\prime}(x)>0)) since the curve opens upwards.
Answer:
A. the interval from (A) to (B)