the figure shows the graph of a periodic function ( f ) in the ( xy )-plane. what is the frequency of ( f…
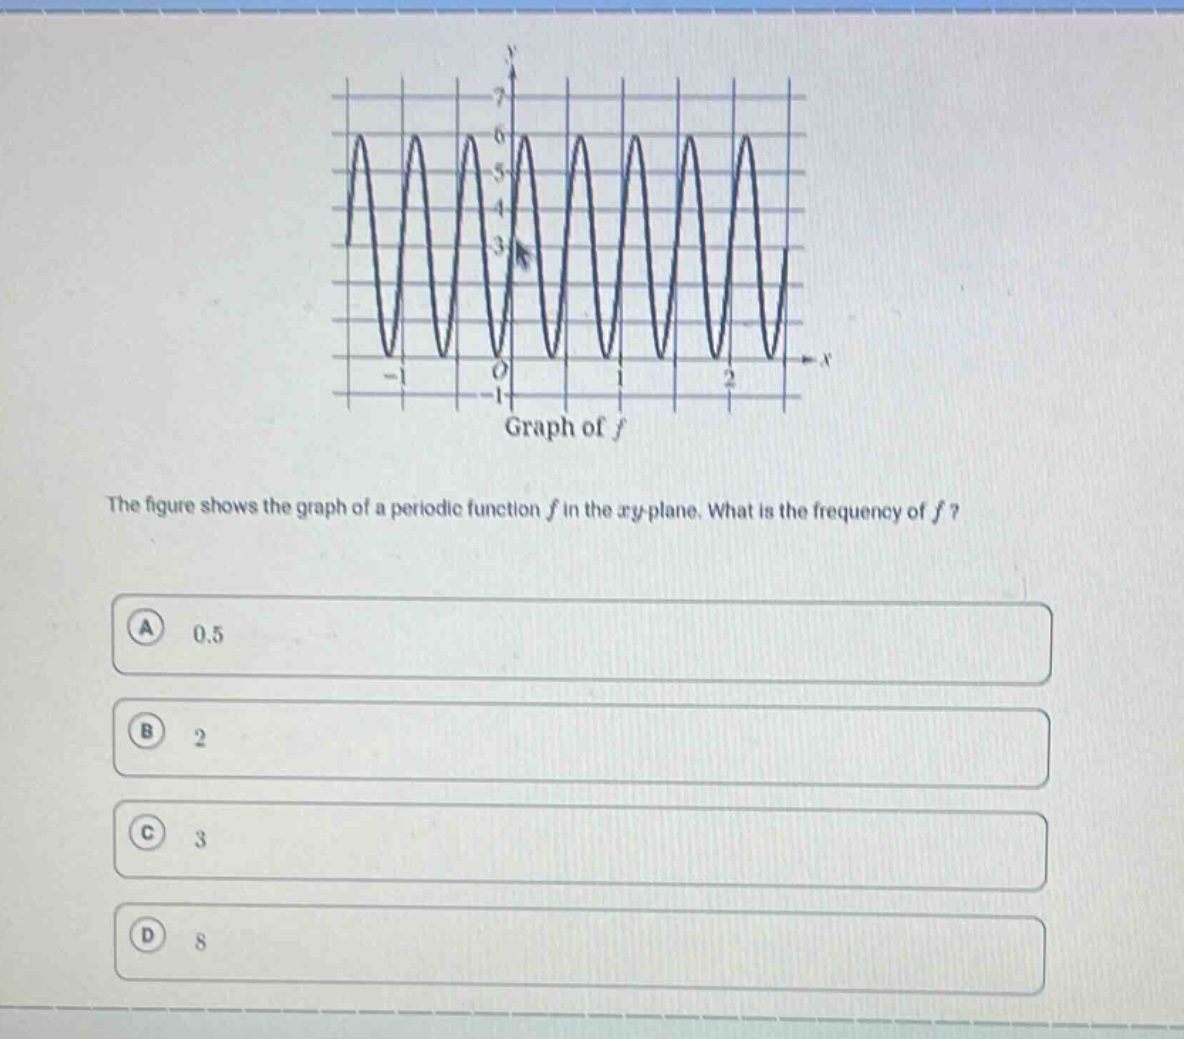
the figure shows the graph of a periodic function ( f ) in the ( xy )-plane. what is the frequency of ( f )?\na 0.5\nb 2\nc 3\nd 8
Answer
Explanation:
Step1: Identify the period
From the graph, we can see that one - complete cycle of the function occurs from (x = 0) to (x=0.5). So the period (T = 0.5).
Step2: Use the frequency - period formula
The formula for frequency (f) in terms of period (T) is (f=\frac{1}{T}). Substituting (T = 0.5=\frac{1}{2}) into the formula, we get (f=\frac{1}{\frac{1}{2}} = 2).
Answer:
B. 2