the figure shows the velocity of an object for 0 ≤ t ≤ 6. calculate the following estimates of the distance…
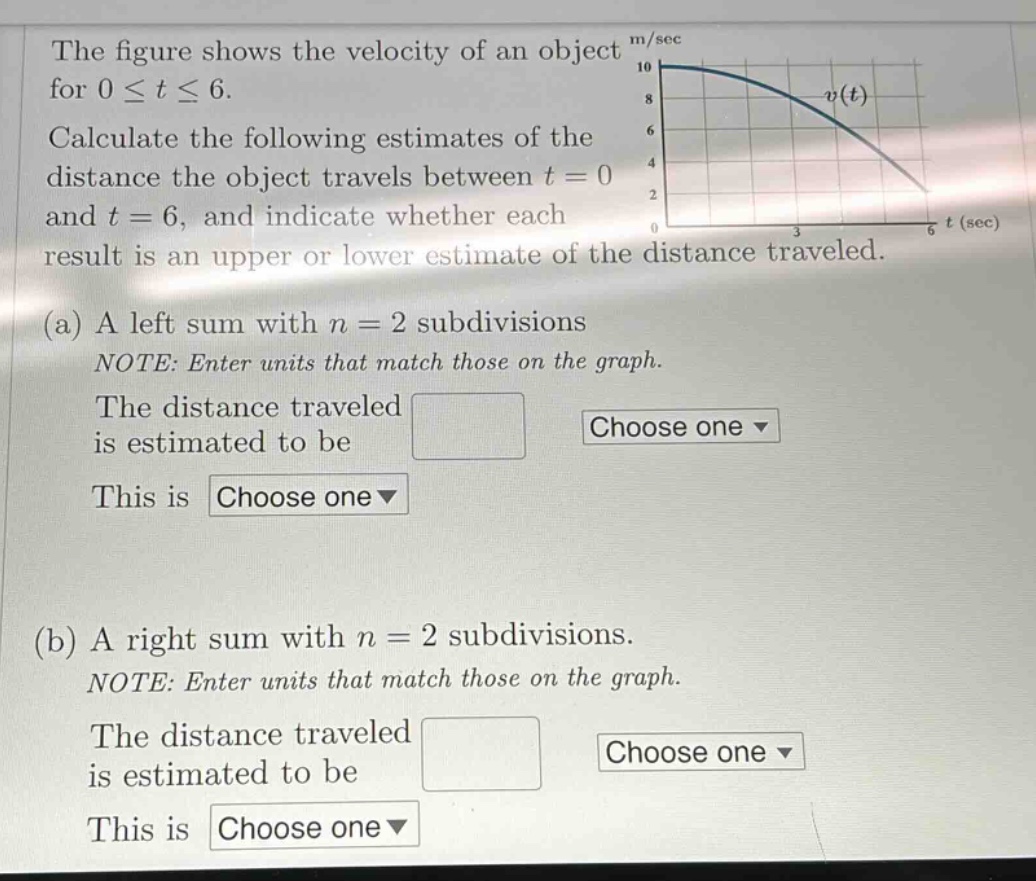
the figure shows the velocity of an object for 0 ≤ t ≤ 6. calculate the following estimates of the distance the object travels between t = 0 and t = 6, and indicate whether each result is an upper or lower estimate of the distance traveled. (a) a left sum with n = 2 subdivisions note: enter units that match those on the graph. the distance traveled is estimated to be this is (b) a right sum with n = 2 subdivisions. note: enter units that match those on the graph. the distance traveled is estimated to be this is
Answer
Explanation:
Step1: Determine the width of sub - intervals
The interval is $[0,6]$ and $n = 2$. The width of each sub - interval $\Delta t=\frac{6 - 0}{2}=3$. The sub - intervals are $[0,3]$ and $[3,6]$.
Step2: Calculate left - sum
For the left - sum with $n = 2$, we use the left - hand endpoints of the sub - intervals. From the graph, $v(0)\approx9$ and $v(3)\approx7$. The left - sum $L_2=v(0)\Delta t+v(3)\Delta t=(9\times3)+(7\times3)=27 + 21=48$ m. Since the velocity function $v(t)$ is decreasing, the left - sum is an upper estimate.
Step3: Calculate right - sum
For the right - sum with $n = 2$, we use the right - hand endpoints of the sub - intervals. From the graph, $v(3)\approx7$ and $v(6)\approx3$. The right - sum $R_2=v(3)\Delta t+v(6)\Delta t=(7\times3)+(3\times3)=21 + 9=30$ m. Since the velocity function $v(t)$ is decreasing, the right - sum is a lower estimate.
Answer:
(a) The distance traveled is estimated to be 48 m. This is an upper estimate. (b) The distance traveled is estimated to be 30 m. This is a lower estimate.