find the graph of the function: y = sin(-x).
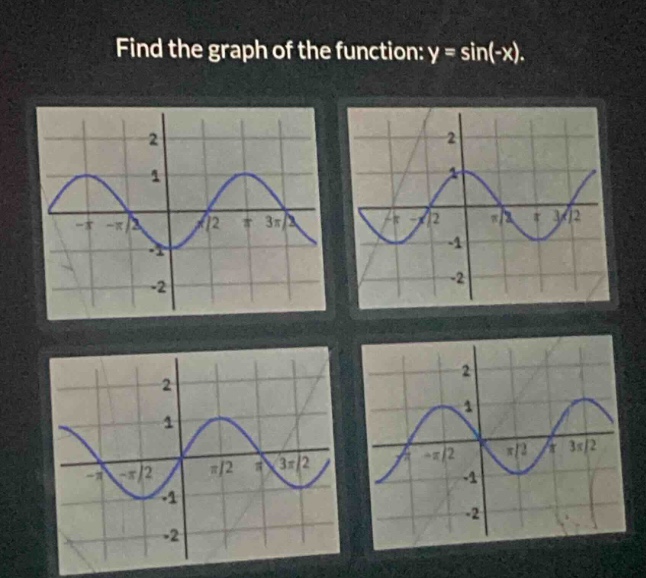
find the graph of the function: y = sin(-x).
Answer
Explanation:
Step1: Recall the property of sine - function
The sine - function is an odd function, i.e., $\sin(-x)=-\sin(x)$.
Step2: Analyze the graph of $y = \sin(x)$
The graph of $y = \sin(x)$ has an amplitude of $1$, a period of $2\pi$, and passes through the points $(0,0)$, $(\frac{\pi}{2},1)$, $(\pi,0)$, $(\frac{3\pi}{2}, - 1)$, and $(2\pi,0)$.
Step3: Analyze the graph of $y=\sin(-x)=-\sin(x)$
The graph of $y =-\sin(x)$ is the reflection of the graph of $y=\sin(x)$ about the $x$ - axis. When $x = 0$, $y=\sin(0)=0$; when $x=\frac{\pi}{2}$, $y =-\sin(\frac{\pi}{2})=-1$; when $x=\pi$, $y =-\sin(\pi)=0$; when $x=\frac{3\pi}{2}$, $y=-\sin(\frac{3\pi}{2}) = 1$; when $x = 2\pi$, $y=-\sin(2\pi)=0$.
Answer:
The graph of $y = \sin(-x)$ is the graph of $y=\sin(x)$ reflected about the $x$ - axis. Among the given options, the correct graph is the one where the peaks and troughs of the standard sine - wave are inverted. Without seeing the specific labels on the options, the key characteristic is that it has the opposite $y$ - values compared to the graph of $y = \sin(x)$ for the same $x$ - values.