the following figure gives the graph of the derivative of a continuous function f that passes through the…
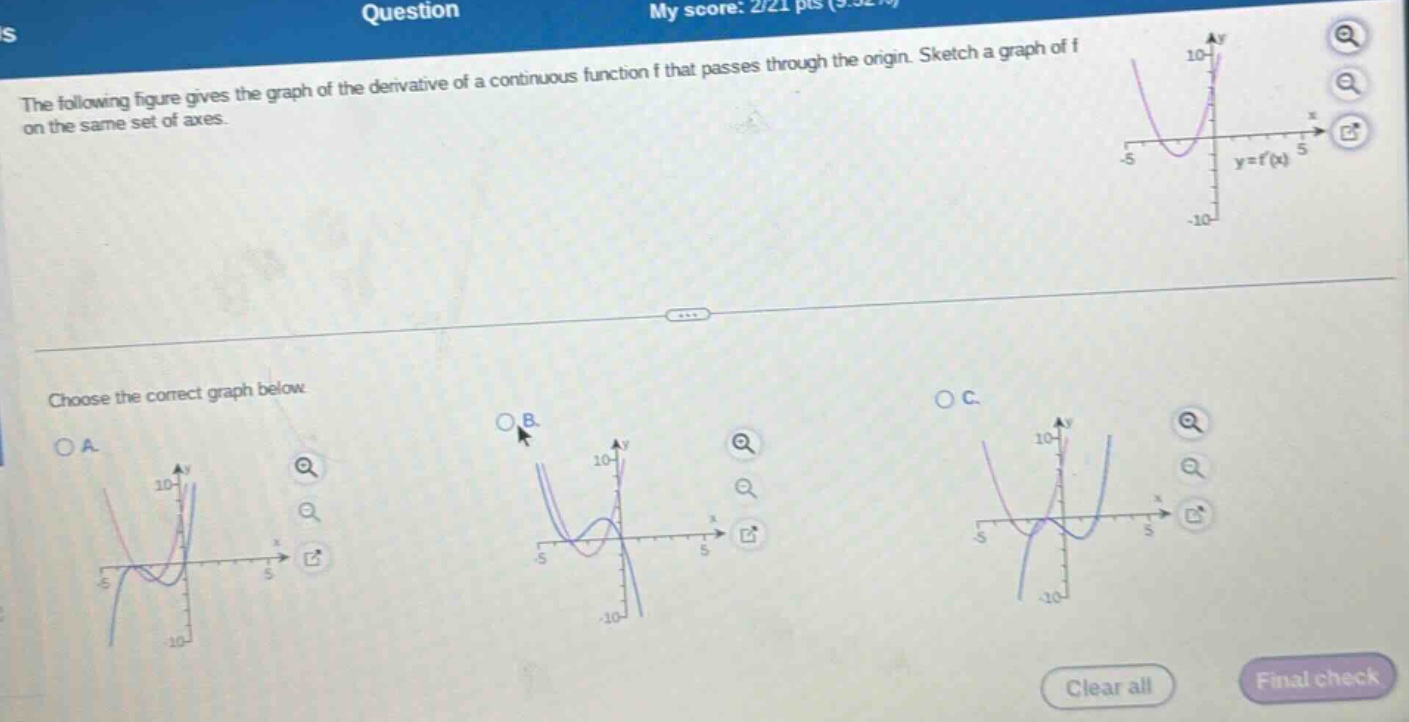
the following figure gives the graph of the derivative of a continuous function f that passes through the origin. sketch a graph of f on the same set of axes. choose the correct graph below.
Answer
Explanation:
Step1: Recall derivative - function relationship
If (f^{\prime}(x)>0), (f(x)) is increasing. If (f^{\prime}(x)<0), (f(x)) is decreasing. Where (f^{\prime}(x) = 0), (f(x)) has a critical - point (local maximum, local minimum or an inflection - point).
Step2: Analyze the given (y = f^{\prime}(x)) graph
The graph of (y = f^{\prime}(x)) is negative on some interval to the left of the (y) - axis, so (f(x)) is decreasing on that interval. The graph of (y = f^{\prime}(x)) is positive on some interval to the right of the (y) - axis, so (f(x)) is increasing on that interval. Also, since (f(x)) passes through the origin ((0,0)).
Step3: Evaluate the options
Option A: Does not start at the origin. Option B: Starts at the origin, has a decreasing part (where (f^{\prime}(x)<0)) and an increasing part (where (f^{\prime}(x)>0)). Option C: Does not have the correct increasing - decreasing behavior based on the (f^{\prime}(x)) graph.
Answer:
B.