which of the following is the graph of $y = 3secleft2left(x-\frac{pi}{2}\right)\right+2$?
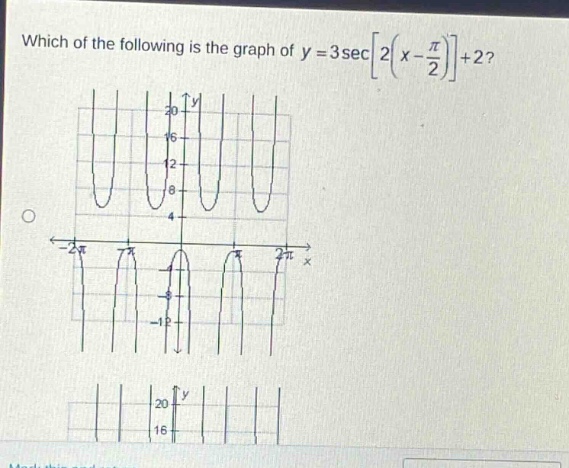
which of the following is the graph of $y = 3secleft2left(x-\frac{pi}{2}\right)\right+2$?
Answer
Explanation:
Step1: Recall secant - function properties
The general form of a secant function is (y = A\sec(B(x - C))+D). For the function (y = 3\sec\left[2\left(x-\frac{\pi}{2}\right)\right]+2), we have (A = 3), (B = 2), (C=\frac{\pi}{2}), and (D = 2).
Step2: Find the period
The period of the secant function (y = A\sec(B(x - C))+D) is given by (T=\frac{2\pi}{|B|}). Since (B = 2), the period (T=\frac{2\pi}{2}=\pi).
Step3: Find the vertical shift
The value of (D) gives the vertical shift. Here, (D = 2), so the graph is shifted 2 units up.
Step4: Find the phase - shift
The phase - shift is given by (C=\frac{\pi}{2}), so the graph is shifted (\frac{\pi}{2}) units to the right.
Step5: Analyze the amplitude (for secant, it's related to the range)
The value of (A) affects the range. Since (A = 3), the range of (y = 3\sec\left[2\left(x-\frac{\pi}{2}\right)\right]+2) is (y\leq - 3 + 2=-1) or (y\geq3 + 2 = 5).
We can also check key points. The secant function (y=\sec x) has vertical asymptotes at (x=(2n + 1)\frac{\pi}{2},n\in\mathbb{Z}). For (y = 3\sec\left[2\left(x-\frac{\pi}{2}\right)\right]+2), the vertical asymptotes are found by setting (2\left(x-\frac{\pi}{2}\right)=(2n + 1)\frac{\pi}{2}). [2x-\pi=(2n + 1)\frac{\pi}{2}] [2x=(2n + 1)\frac{\pi}{2}+\pi=\frac{(2n + 1)\pi+2\pi}{2}=\frac{(2n + 3)\pi}{2}] [x=\frac{(2n + 3)\pi}{4}]
When (x=\frac{\pi}{2}), (y = 3\sec(0)+2=3\times1 + 2=5)
By analyzing the period, vertical - shift, phase - shift, and range, we can identify the correct graph.
Answer:
The graph that has a period of (\pi), is shifted 2 units up and (\frac{\pi}{2}) units to the right, and has a range (y\leq - 1) or (y\geq5) (the upper - part of the graph has (y) values starting from (y = 5) and the lower - part has (y) values starting from (y=-1)) is the correct graph. Without the full set of options, we can't exactly point out which one it is from the given partial - image, but the above analysis gives the characteristics of the graph of (y = 3\sec\left[2\left(x-\frac{\pi}{2}\right)\right]+2).