for the following graph of a function, estimate the area under the curve in the interval -3,4 using the…
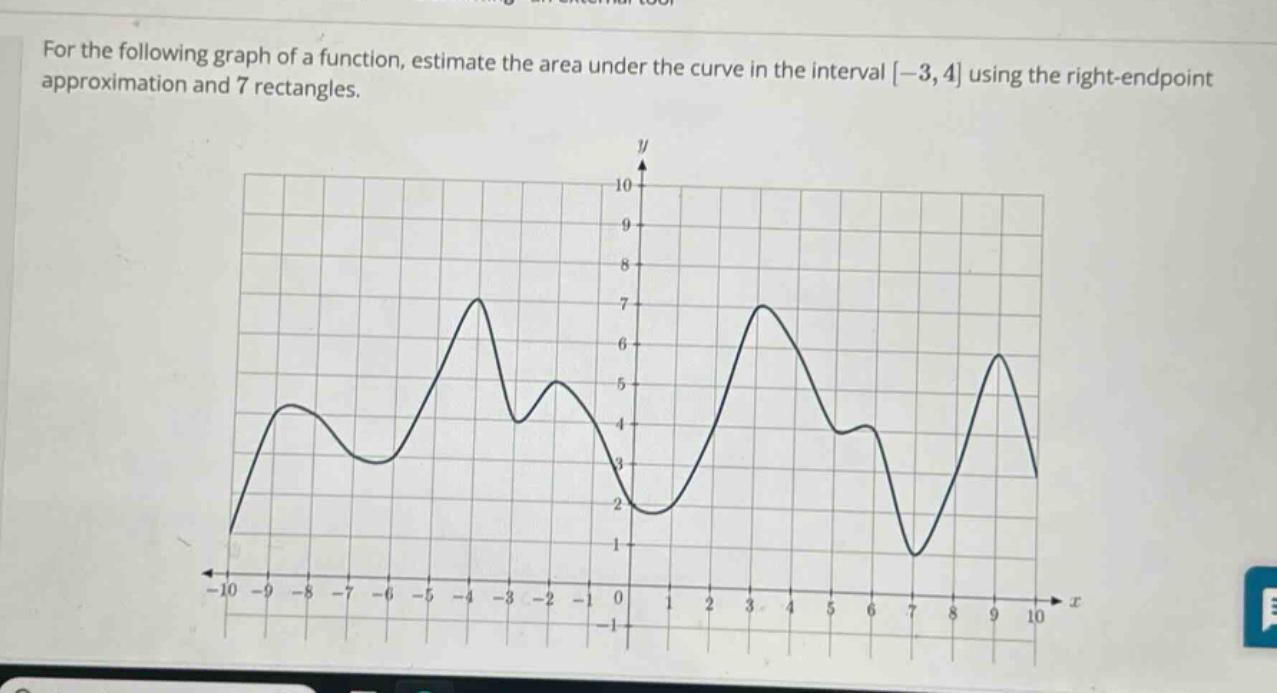
for the following graph of a function, estimate the area under the curve in the interval -3,4 using the right - endpoint approximation and 7 rectangles.
Answer
Explanation:
Step1: Calculate the width of each rectangle
The interval is $[-3,4]$, and $n = 7$. The width $\Delta x=\frac{b - a}{n}$, where $a=-3$ and $b = 4$. So $\Delta x=\frac{4-(-3)}{7}=\frac{7}{7}=1$.
Step2: Determine the right - endpoints
The right - endpoints of the 7 sub - intervals are $x_1=-2,x_2=-1,x_3 = 0,x_4=1,x_5=2,x_6=3,x_7=4$.
Step3: Estimate the function values at the right - endpoints
By looking at the graph, estimate the function values $f(x_1),f(x_2),\cdots,f(x_7)$. Let's assume the estimated values are $f(-2)\approx5,f(-1)\approx4,f(0)\approx2,f(1)\approx3,f(2)\approx7,f(3)\approx4,f(4)\approx7$.
Step4: Calculate the area of each rectangle and sum them up
The area of each rectangle is $A_i=f(x_i)\Delta x$. The sum $R_7=\sum_{i = 1}^{7}f(x_i)\Delta x$. Since $\Delta x = 1$, $R_7=f(-2)+f(-1)+f(0)+f(1)+f(2)+f(3)+f(4)\approx5 + 4+2+3+7+4+7=32$.
Answer:
32