which of the following is the graph of y = ln (x - 2)?
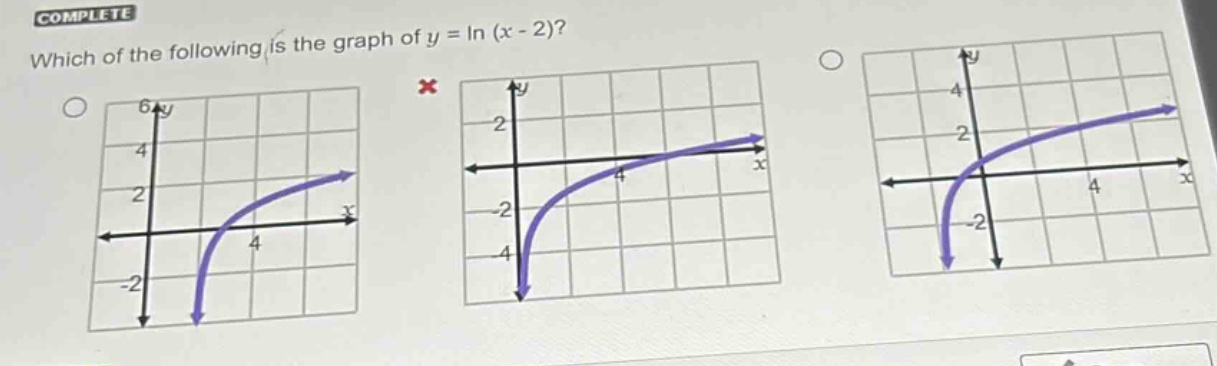
which of the following is the graph of y = ln (x - 2)?
Answer
Explanation:
Step1: Recall the properties of the natural - log function
The parent function of $y = \ln(x - 2)$ is $y=\ln(x)$. The domain of $y = \ln(x)$ is $x>0$, and for $y=\ln(x - 2)$, the domain is $x-2>0$ or $x > 2$. The graph of $y=\ln(x)$ has a vertical asymptote at $x = 0$. For $y=\ln(x - 2)$, the vertical asymptote is at $x=2$.
Step2: Analyze the transformation
The graph of $y = f(x - h)$ is a horizontal shift of the graph of $y = f(x)$ to the right by $h$ units. Here, $h = 2$, so the graph of $y=\ln(x)$ is shifted 2 units to the right.
Step3: Check the graphs
We look for a graph that has a vertical asymptote at $x = 2$ and has the general shape of the natural - log function (increasing, concave - down).
Answer:
The graph that has a vertical asymptote at $x = 2$ and is an increasing, concave - down curve starting from the right of $x = 2$ is the correct one. Without specific labels on the graphs in the image, we can't point out which one exactly among the given options, but it should be the one with a vertical asymptote at $x=2$ and increasing behavior for $x>2$.