the following graph shows a curve that is a transformation of $y = \\sin(x)$. a) what is the period of the…
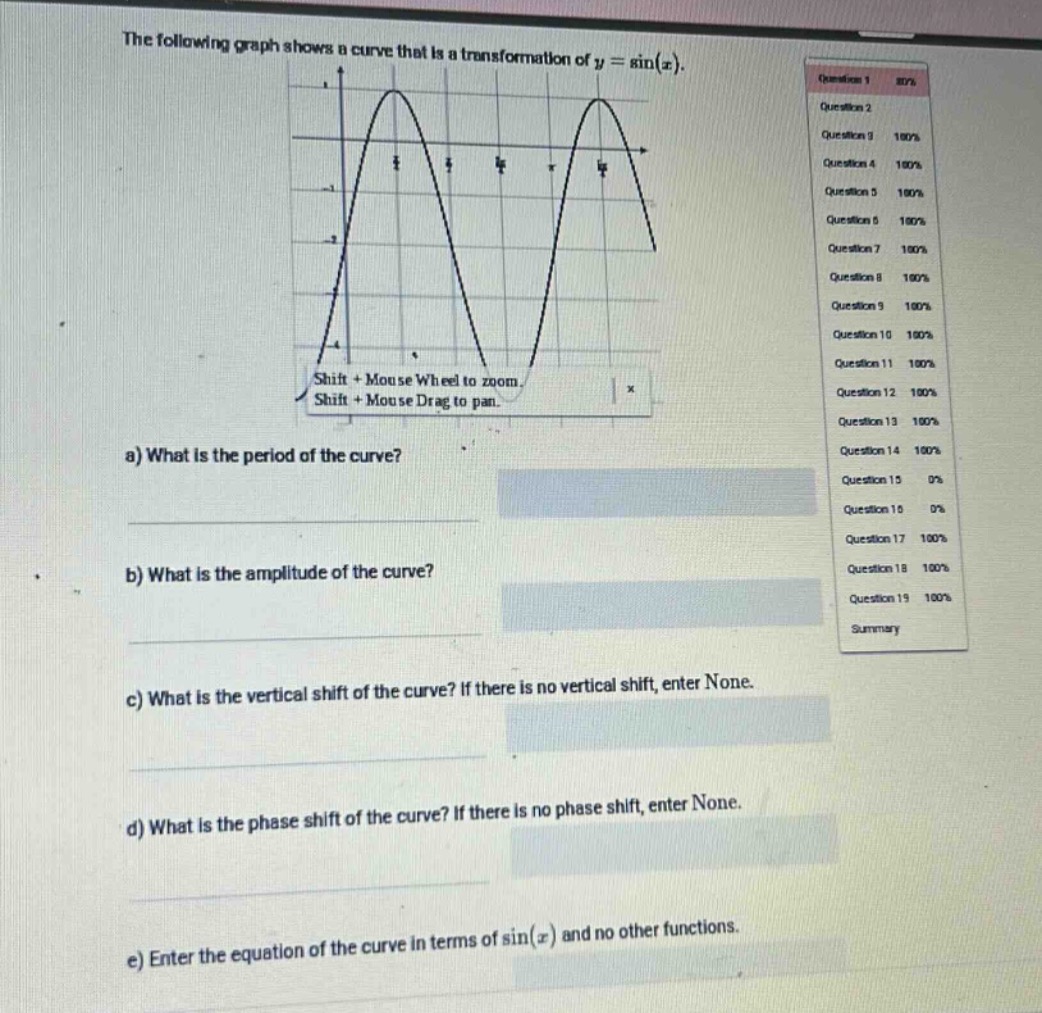
the following graph shows a curve that is a transformation of $y = \\sin(x)$. a) what is the period of the curve? b) what is the amplitude of the curve? c) what is the vertical shift of the curve? if there is no vertical shift, enter none. d) what is the phase shift of the curve? if there is no phase shift, enter none. e) enter the equation of the curve in terms of $\\sin(x)$ and no other functions.
Answer
Explanation:
Step1: Identify period from graph
The period is the horizontal length for one - complete cycle. By observing the graph, the curve repeats itself over an interval of (2\pi). So the period (T = 2\pi).
Step2: Identify amplitude from graph
The amplitude (A) is the distance from the mid - line to the maximum or minimum of the curve. The maximum value is (3) and the minimum value is (- 1). The mid - line is (y = 1). So (A=\frac{3 - (-1)}{2}=2).
Step3: Identify vertical shift from graph
The mid - line of the sine function (y = \sin(x)) is (y = 0). The mid - line of the given curve is (y = 1). So the vertical shift (D = 1).
Step4: Identify phase shift from graph
The sine function (y=\sin(x)) has a zero - crossing at (x = 0). The corresponding zero - crossing of the given curve is at (x=-\frac{\pi}{2}). So the phase shift (C=-\frac{\pi}{2}).
Step5: Write the equation of the curve
The general form of a sinusoidal function is (y = A\sin(B(x - C))+D). Since (B = 1) (because (T=\frac{2\pi}{B}) and (T = 2\pi)), (A = 2), (C=-\frac{\pi}{2}), and (D = 1), the equation is (y=2\sin(x+\frac{\pi}{2})+1).
Answer:
a) (2\pi) b) (2) c) (1) d) (-\frac{\pi}{2}) e) (y = 2\sin(x+\frac{\pi}{2})+1)