the following graph shows hans chromebook battery level percentage over a period of 12 hours, beginning at…
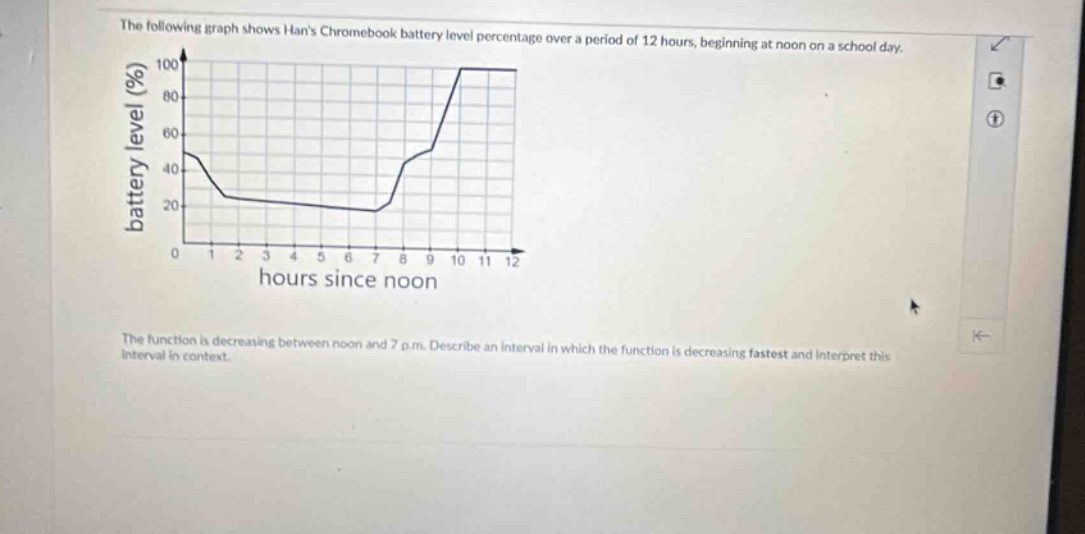
the following graph shows hans chromebook battery level percentage over a period of 12 hours, beginning at noon on a school day. the function is decreasing between noon and 7 p.m. describe an interval in which the function is decreasing fastest and interpret this interval in context.
Answer
Explanation:
Step1: Observe the slope of the graph
The steeper the negative - slope, the faster the decrease.
Step2: Identify the steepest decreasing part
By looking at the graph, the function is decreasing fastest between 0 and 1 hour since noon.
Step3: Interpret in context
This means that in the first hour after noon (from noon to 1 p.m.), Han's Chromebook battery level drops the most rapidly.
Answer:
The function is decreasing fastest in the interval 0 - 1 hour since noon. This implies that from noon to 1 p.m., Han's Chromebook battery level decreases at the highest rate.