which of the following is the graph of this square root function? f(x) = \\sqrt{x + 1} + 5
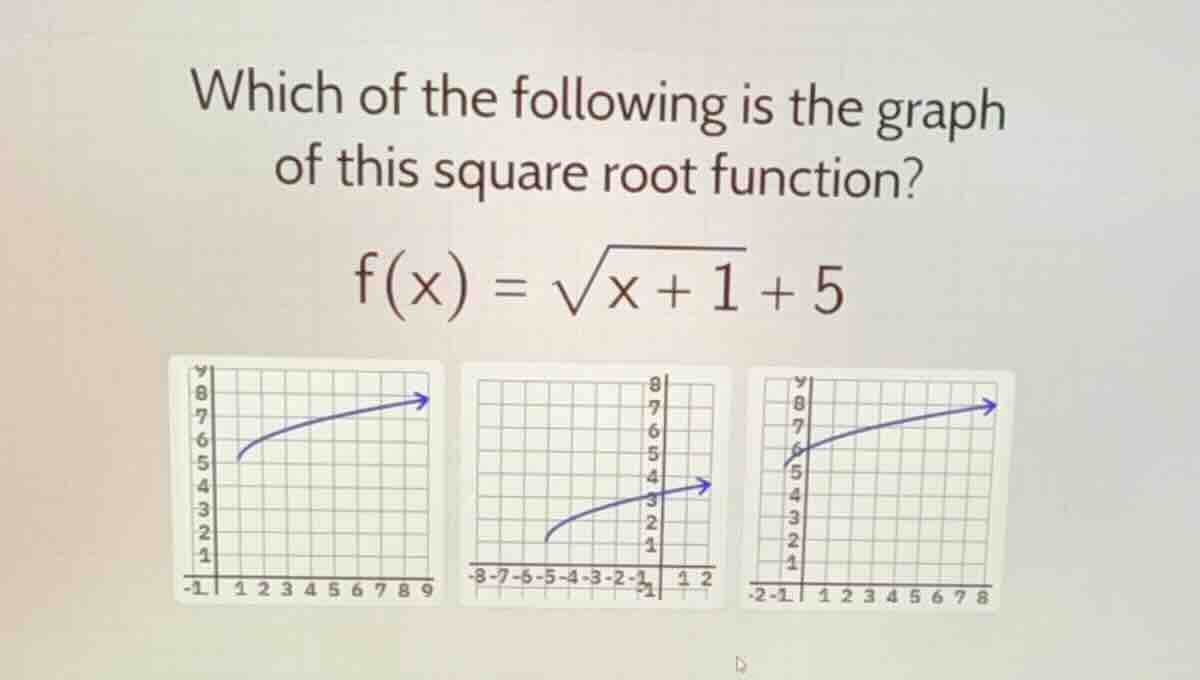
which of the following is the graph of this square root function? f(x) = \\sqrt{x + 1} + 5
Answer
Explanation:
Step1: Find the domain of the function
For the square root function ( f(x)=\sqrt{x + 1}+5 ), the expression inside the square root must be non - negative. So we set ( x + 1\geq0 ), which gives ( x\geq - 1 ). This means the graph of the function should start at ( x=-1 ) (or to the right of ( x = - 1)).
Step2: Find the y - intercept (when ( x = 0))
Substitute ( x = 0) into the function ( f(x)=\sqrt{x + 1}+5 ). We get ( f(0)=\sqrt{0 + 1}+5=1 + 5=6 )? Wait, no, wait. Wait, when ( x=-1), ( f(-1)=\sqrt{-1 + 1}+5=\sqrt{0}+5 = 5). Let's re - calculate the y - intercept (when ( x = 0)): ( f(0)=\sqrt{0 + 1}+5=1 + 5 = 6)? Wait, no, the starting point (the vertex of the square root function) for ( y=\sqrt{x - h}+k) is at ( (h,k)). For our function ( f(x)=\sqrt{x+1}+5=\sqrt{x-(-1)}+5 ), the vertex is at ( (-1,5)).
Now let's analyze the three graphs:
- The first graph: The domain starts around ( x = 1)? No, wait, looking at the x - axis, the first graph has x starting from - 1, and at ( x=-1), the y - value is 5 (since when ( x=-1), ( f(-1)=5)), and as x increases, the function increases. Let's check the value at ( x = 0): ( f(0)=\sqrt{0 + 1}+5=6), so at ( x = 0), ( y = 6)? Wait, no, my mistake earlier. Wait, ( f(x)=\sqrt{x + 1}+5). When ( x=-1), ( f(-1)=0 + 5=5). When ( x = 0), ( f(0)=1 + 5=6). When ( x = 3), ( f(3)=\sqrt{4}+5=2 + 5=7).
Now let's look at the three graphs:
- The first graph: The x - axis starts at - 1, and the curve starts at ( x=-1) with ( y = 5) (since at ( x=-1), ( f(-1)=5)) and as x increases, y increases. Let's check the second graph: The x - axis starts at - 8, and the curve starts at ( x=-4) or so, which is not consistent with our domain ( x\geq - 1). The third graph: The x - axis starts at - 2, but when ( x=-1), let's see the y - value. Wait, the first graph: the grid, when x=-1, the y - coordinate is 5 (from the graph's grid, the first graph has y - axis with 5 at the level where x=-1 starts). The second graph has a lower starting y - value, and the third graph has a starting y - value around 5.5? No, wait, let's re - evaluate.
Wait, the standard square root function ( y=\sqrt{x}) has a domain ( x\geq0) and starts at (0,0). The function ( y=\sqrt{x + 1}) is a horizontal shift of ( y=\sqrt{x}) to the left by 1 unit, so its domain is ( x\geq - 1) and it starts at (- 1,0). Then the function ( y=\sqrt{x + 1}+5) is a vertical shift of ( y=\sqrt{x + 1}) up by 5 units, so it starts at (- 1,5) and increases as x increases.
Now let's check the three graphs:
-
First graph: The x - axis starts at - 1, and the curve starts at ( x=-1) with ( y = 5) (matches the starting point (- 1,5)) and as x increases, the curve goes up (which is the behavior of a square root function, increasing at a decreasing rate).
-
Second graph: The curve starts at ( x=-4) or so, which is outside the domain ( x\geq - 1) of our function, so it's incorrect.
-
Third graph: When ( x=-1), let's see the y - value. The third graph's curve starts at ( x=-1) with ( y\approx5.5) or so, but our function at ( x=-1) should be ( y = 5). Also, the first graph's starting point is at ( x=-1,y = 5), which matches the vertex of our function ( f(x)=\sqrt{x + 1}+5).
Answer:
The first graph (the left - most graph) is the graph of the function ( f(x)=\sqrt{x + 1}+5).