which of the following graphs is the correct plot of $y = -4 \\cos(x)$?
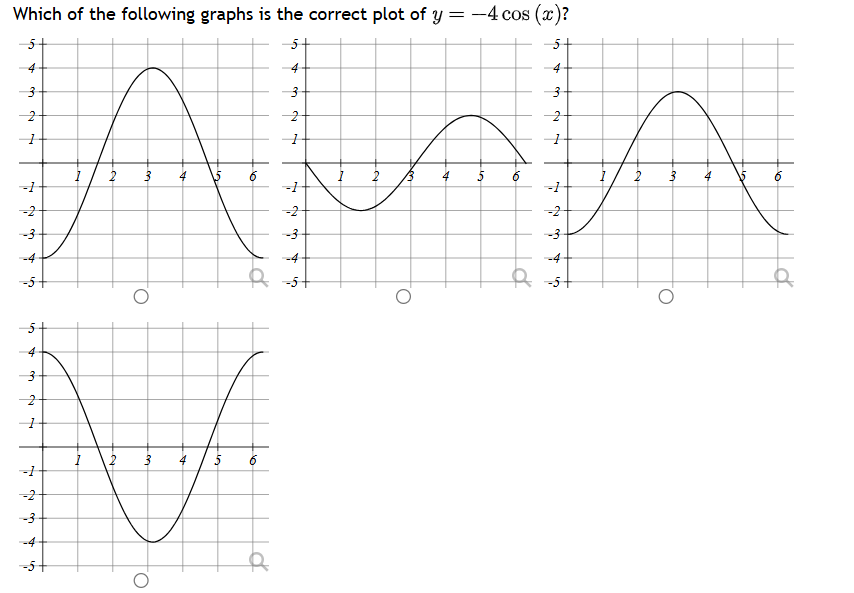
which of the following graphs is the correct plot of $y = -4 \\cos(x)$?
Answer
Explanation:
Step1: Identify the y-intercept
Evaluate the function at $x = 0$. $$y = -4 \cos(0) = -4(1) = -4$$
Step2: Determine the amplitude
The coefficient $-4$ indicates an amplitude of $4$. $$|A| = |-4| = 4$$
Step3: Check the period
The period of $\cos(x)$ is $2\pi$, approximately $6.28$. $$T = 2\pi \approx 6.28$$
Step4: Match with the graphs
The first graph starts at $(0, -4)$, peaks at $x \approx 3.14$, and returns to $-4$ at $x \approx 6.28$.
Answer:
The first graph (top-left) is the correct plot.