for which of the following graphs of a function f(x) does lim x→−∞ f(x)=−2?
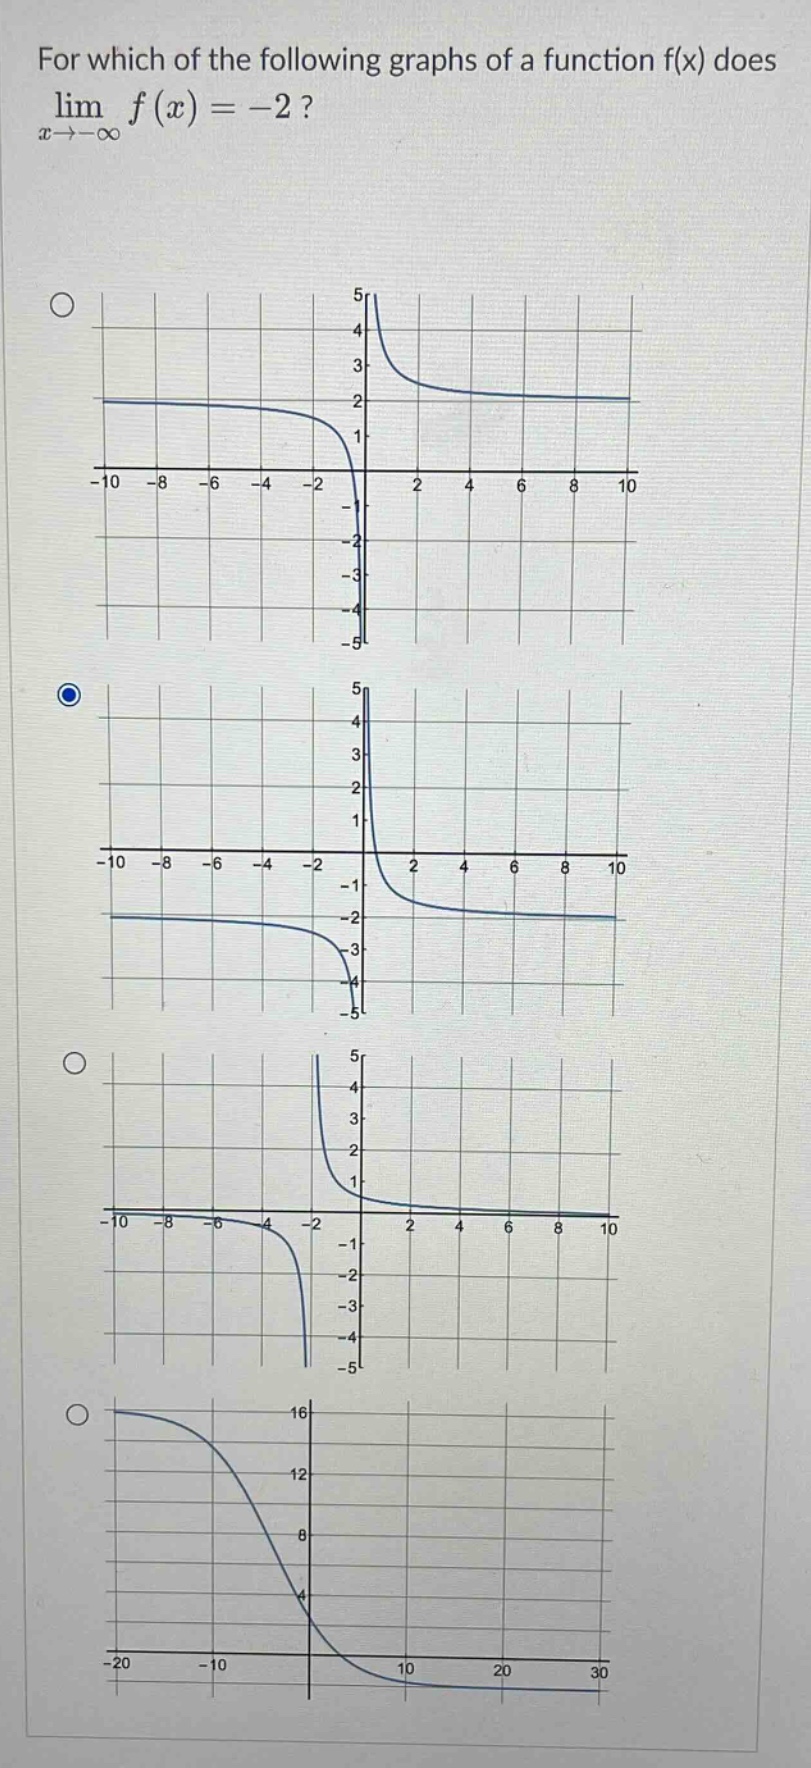
for which of the following graphs of a function f(x) does lim x→−∞ f(x)=−2?
Answer
Explanation:
Step1: Recall limit definition
The limit $\lim_{x\rightarrow-\infty}f(x)= - 2$ means that as $x$ approaches negative - infinity, the function $f(x)$ approaches $-2$. We need to look at the left - hand end behavior of each graph.
Step2: Analyze each graph
For the first graph, as $x\rightarrow-\infty$, $f(x)$ approaches a value greater than $- 2$. For the second graph, as $x\rightarrow-\infty$, $f(x)$ approaches $-2$. For the third graph, as $x\rightarrow-\infty$, $f(x)$ approaches a value less than $-2$. For the fourth graph, as $x\rightarrow-\infty$, $f(x)$ approaches a value greater than $-2$.
Answer:
The second graph.