which of the following represents the graph of: $y = \\frac{1}{2}\\tan(\\frac{x}{3}+\frac{5\\pi}{6}) - 1$
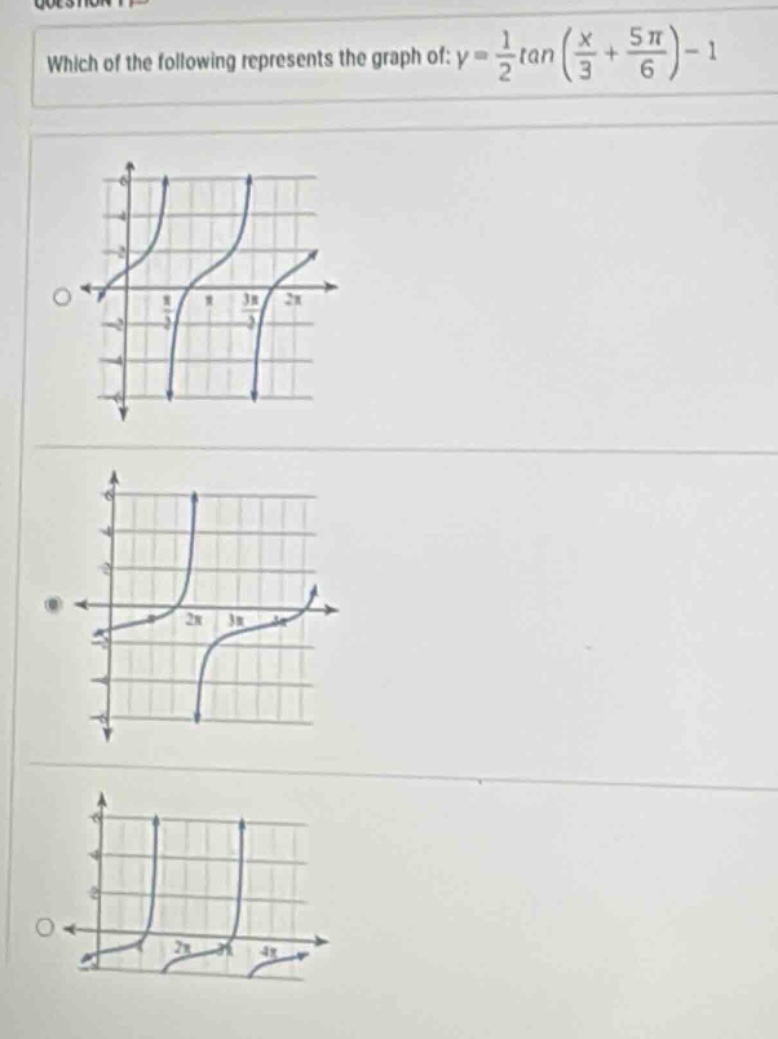
which of the following represents the graph of: $y = \\frac{1}{2}\\tan(\\frac{x}{3}+\frac{5\\pi}{6}) - 1$
Answer
Explanation:
Step1: Recall tangent - function properties
The general form of the tangent function is $y = A\tan(Bx - C)+D$. For the given function $y=\frac{1}{2}\tan(\frac{x}{3}+\frac{5\pi}{6})-1$, we have $A = \frac{1}{2}$, $B=\frac{1}{3}$, $C =-\frac{5\pi}{6}$, $D=-1$.
Step2: Find the period
The period of the tangent function $y = A\tan(Bx - C)+D$ is given by $T=\frac{\pi}{|B|}$. Since $B=\frac{1}{3}$, then $T = 3\pi$.
Step3: Find the vertical shift
The vertical - shift of the function is given by $D$. Here, $D=-1$, which means the graph is shifted down by 1 unit.
Step4: Analyze the phase - shift
The phase - shift is given by $\frac{C}{B}$. Substituting $C =-\frac{5\pi}{6}$ and $B=\frac{1}{3}$, we get $\frac{-\frac{5\pi}{6}}{\frac{1}{3}}=-\frac{5\pi}{2}$.
We can also find the zero - points of the function. Set $y = 0$, then $\frac{1}{2}\tan(\frac{x}{3}+\frac{5\pi}{6})-1=0$. So, $\tan(\frac{x}{3}+\frac{5\pi}{6}) = 2$.
We know that the tangent function $y = \tan x$ has vertical asymptotes at $x=(n+\frac{1}{2})\pi,n\in\mathbb{Z}$. For the function $y=\frac{1}{2}\tan(\frac{x}{3}+\frac{5\pi}{6})-1$, the vertical asymptotes are given by $\frac{x}{3}+\frac{5\pi}{6}=(n + \frac{1}{2})\pi$. Solving for $x$: [ \begin{align*} \frac{x}{3}+\frac{5\pi}{6}&=(n+\frac{1}{2})\pi\ \frac{x}{3}&=(n+\frac{1}{2})\pi-\frac{5\pi}{6}\ \frac{x}{3}&=n\pi+\frac{\pi}{2}-\frac{5\pi}{6}\ \frac{x}{3}&=n\pi-\frac{\pi}{3}\ x&=3n\pi - \pi \end{align*} ]
By analyzing the period, vertical shift, and asymptotes, we can identify the correct graph.
Since the period is $3\pi$ and there is a vertical shift of $- 1$ unit, we can eliminate graphs that do not match these characteristics.
Answer:
(Without seeing the full - set of options clearly, we cannot give a specific option. But the above steps can be used to analyze and choose the correct graph among the given options. If we assume the options are Option A, Option B, Option C corresponding to the three graphs shown, we would need to further analyze the asymptotes, zero - points and the general shape based on the period and shift to pick the right one.)