which of the following shows the graph of $y = 2ln x$?
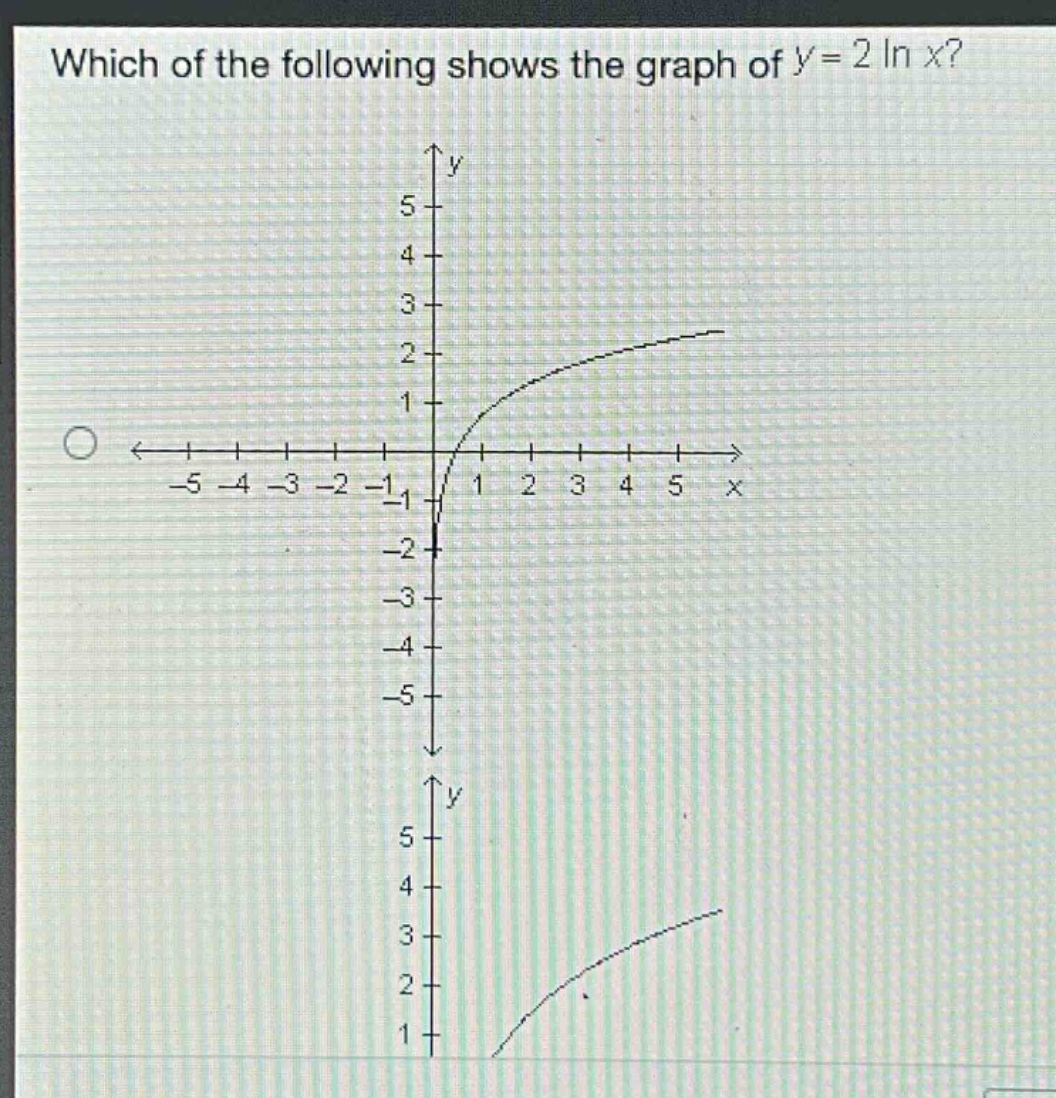
which of the following shows the graph of $y = 2ln x$?
Answer
Explanation:
Step1: Recall properties of $y = \ln x$
The domain of $y=\ln x$ is $x>0$, and it passes through the point $(1,0)$ with a slow - increasing rate as $x$ increases.
Step2: Analyze $y = 2\ln x$
The function $y = 2\ln x$ is a vertical stretch of $y=\ln x$ by a factor of 2. When $x = 1$, $y=2\ln(1)=0$. As $x$ increases, the values of $y$ for $y = 2\ln x$ are twice the values of $y$ for $y=\ln x$. Also, the domain remains $x>0$.
Answer:
The graph that has a domain of $x>0$, passes through the point $(1,0)$ and is steeper than the graph of $y = \ln x$ (a vertical stretch of the natural - logarithm function by a factor of 2). Without seeing all the options, we can't pick a specific choice from the given images, but it should have these characteristics.