which of the following shows the graph of $y = \\ln(-2x)$?
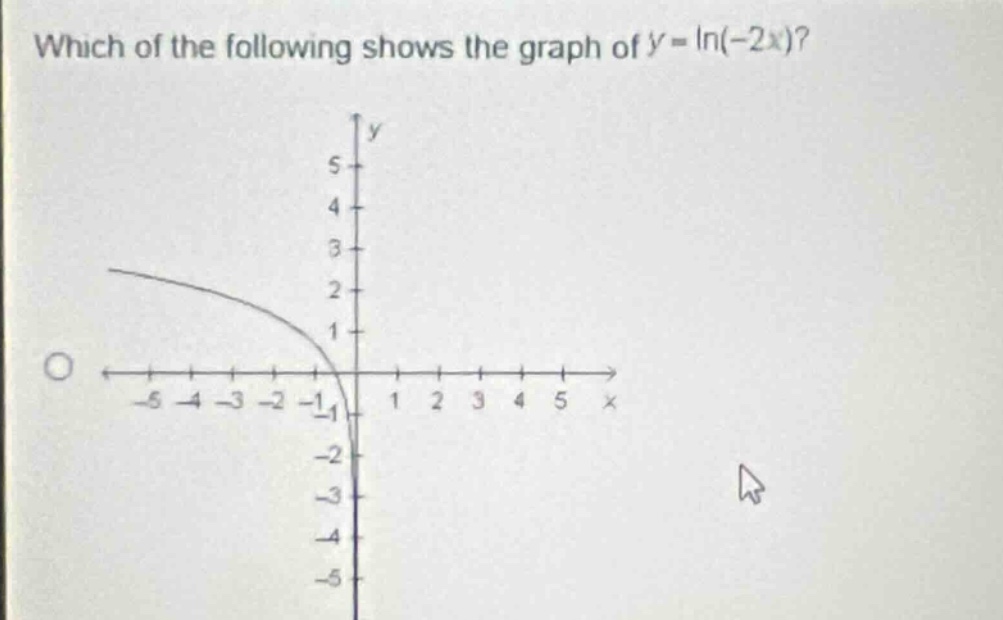
which of the following shows the graph of $y = \\ln(-2x)$?
Answer
Explanation:
Step1: Analyze domain
For $y = \ln(-2x)$, the argument of the logarithm must be positive, so $-2x>0$, which gives $x < 0$. The graph exists only for negative - x values.
Step2: Consider transformation
The parent - function is $y=\ln(x)$. The negative sign in front of $2x$ reflects the graph of $y = \ln(2x)$ across the y - axis. And the coefficient 2 compresses the graph of $y=\ln(x)$ horizontally by a factor of $\frac{1}{2}$.
Answer:
The graph that exists for $x<0$ and has the general shape of a natural - logarithm function (increasing, concave - down) is the correct one. Since no other options are given, based on the domain and transformation analysis, the graph shown (assuming it has $x < 0$ domain and correct logarithmic shape) is the graph of $y=\ln(-2x)$.