the following table gives the percentage, p, of households with a television set that also have a vcr…
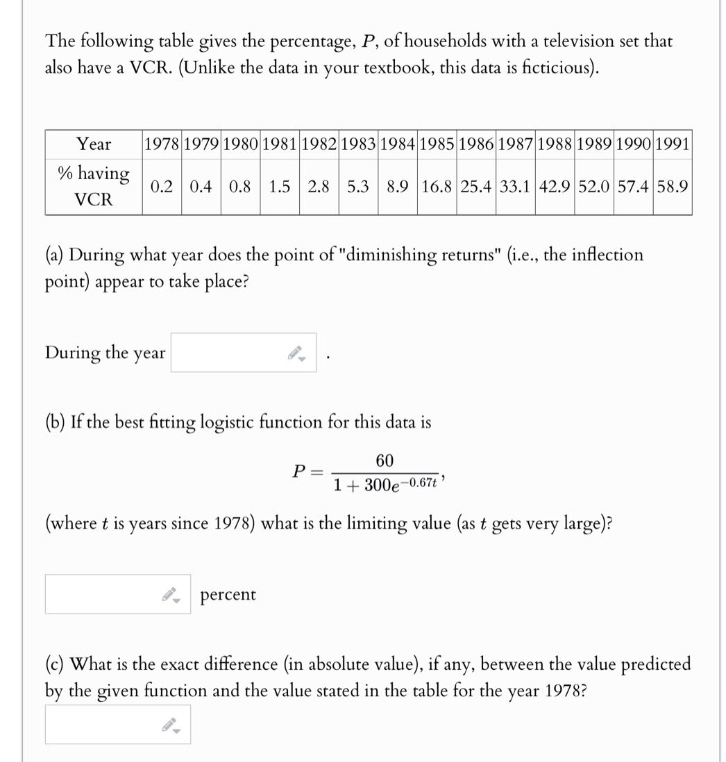
the following table gives the percentage, p, of households with a television set that also have a vcr. (unlike the data in your textbook, this data is fictitious).\nyear 1978 1979 1980 1981 1982 1983 1984 1985 1986 1987 1988 1989 1990 1991\n% having vcr 0.2 0.4 0.8 1.5 2.8 5.3 8.9 16.8 25.4 33.1 42.9 52.0 57.4 58.9\n(a) during what year does the point of \diminishing returns\ (i.e., the inflection point) appear to take place?\nduring the year \n(b) if the best fitting logistic function for this data is p = 60 / (1 + 300e^(-0.67t)), (where t is years since 1978) what is the limiting value (as t gets very large)?\n percent\n(c) what is the exact difference (in absolute value), if any, between the value predicted by the given function and the value stated in the table for the year 1978?
Answer
Explanation:
Step1: Identify inflection - point concept
The inflection point in a logistic - type growth occurs when the second - derivative of the function changes sign. In the context of growth data, it is the point where the rate of growth starts to slow down. Looking at the percentage values, we can observe the change in the rate of increase. The differences between consecutive percentage values are: For 1978 - 1979: (0.4 - 0.2=0.2) For 1979 - 1980: (0.8 - 0.4 = 0.4) For 1980 - 1981: (1.5 - 0.8 = 0.7) For 1981 - 1982: (2.8 - 1.5 = 1.3) For 1982 - 1983: (5.3 - 2.8 = 2.5) For 1983 - 1984: (8.9 - 5.3 = 3.6) For 1984 - 1985: (16.8 - 8.9 = 7.9) For 1985 - 1986: (25.4 - 16.8 = 8.6) For 1986 - 1987: (33.1 - 25.4 = 7.7) The rate of increase starts to slow down around 1986.
Step2: Find the limiting value of the logistic function
The logistic function is given by (P=\frac{60}{1 + 300e^{-0.67t}}). As (t\to\infty), (e^{-0.67t}\to0) since the exponential function (y = e^{-ax}) with (a>0) approaches 0 as (x\to\infty). So, (\lim_{t\to\infty}P=\lim_{t\to\infty}\frac{60}{1 + 300e^{-0.67t}}=\frac{60}{1+0}=60).
Step3: Calculate the predicted value for 1978 and find the difference
For (t = 0) (since (t) is years since 1978), (P=\frac{60}{1 + 300e^{-0.67\times0}}=\frac{60}{1 + 300}=\frac{60}{301}\approx0.1993). The value in the table for 1978 is (0.2). The absolute - value difference is (|0.2-\frac{60}{301}|=| \frac{0.2\times301-60}{301}|=|\frac{60.2 - 60}{301}|=\frac{0.2}{301}\approx0.0007).
Answer:
(a) 1986 (b) 60 (c) (0.0007)