the function y = f(x) is graphed below. what is the average rate of change of the function f(x) on the…
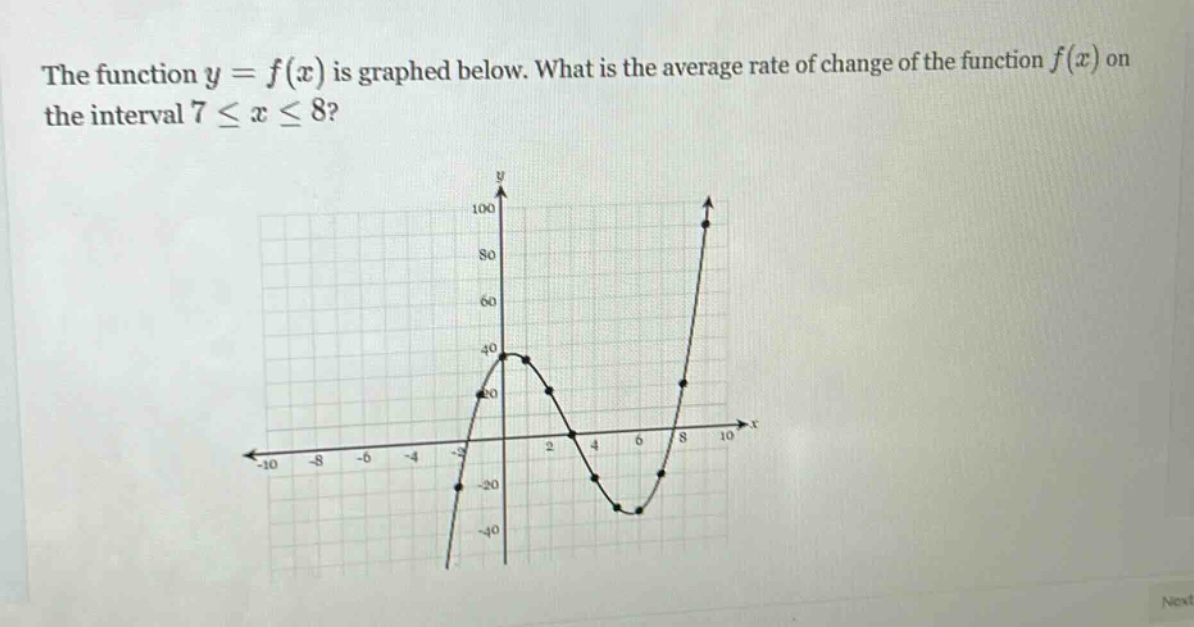
the function y = f(x) is graphed below. what is the average rate of change of the function f(x) on the interval 7 ≤ x ≤ 8?
Answer
Explanation:
Step1: Identificar los valores de la función en los extremos del intervalo
Observando la gráfica, cuando $x = 7$, $y=f(7)= - 20$ y cuando $x = 8$, $y=f(8)=80$.
Step2: Aplicar la fórmula para la tasa de cambio promedio
La fórmula para la tasa de cambio promedio de una función $y = f(x)$ en el intervalo $[a,b]$ es $\frac{f(b)-f(a)}{b - a}$. Aquí, $a = 7$, $b = 8$, $f(7)=-20$ y $f(8)=80$. Entonces, $\frac{f(8)-f(7)}{8 - 7}=\frac{80-(-20)}{8 - 7}$.
Step3: Realizar los cálculos
$\frac{80 + 20}{1}=\frac{100}{1}=100$.
Answer:
100