the function f(x) is graphed below. how many points on the graph represent a relative extreme value?
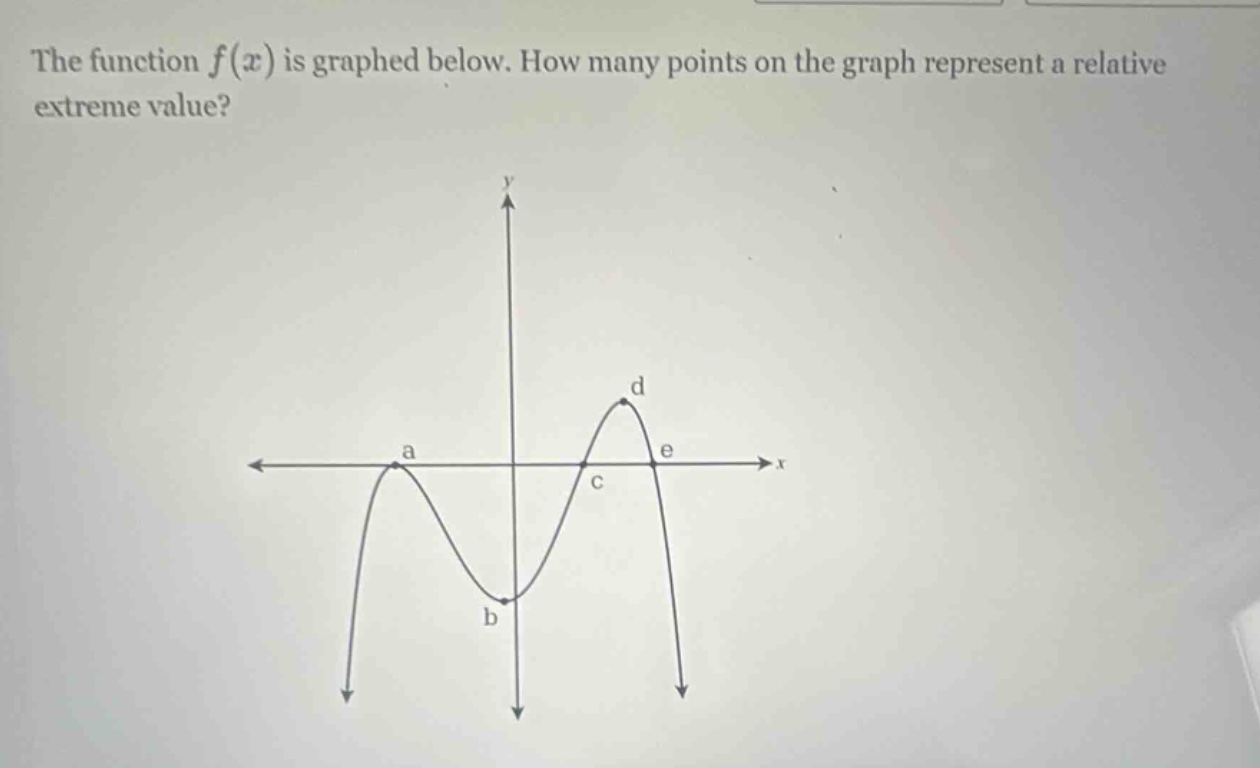
the function f(x) is graphed below. how many points on the graph represent a relative extreme value?
Answer
Explanation:
Step1: Recall relative - extreme definition
A relative maximum occurs where the function changes from increasing to decreasing, and a relative minimum occurs where the function changes from decreasing to increasing.
Step2: Analyze the graph
At point a, the function changes from increasing to decreasing, so it is a relative maximum. At point b, the function changes from decreasing to increasing, so it is a relative minimum. At point d, the function changes from increasing to decreasing, so it is a relative maximum.
Answer:
3