the function f(x) is graphed below. what is true about the graph on the interval from x = i to x = ∞? answer…
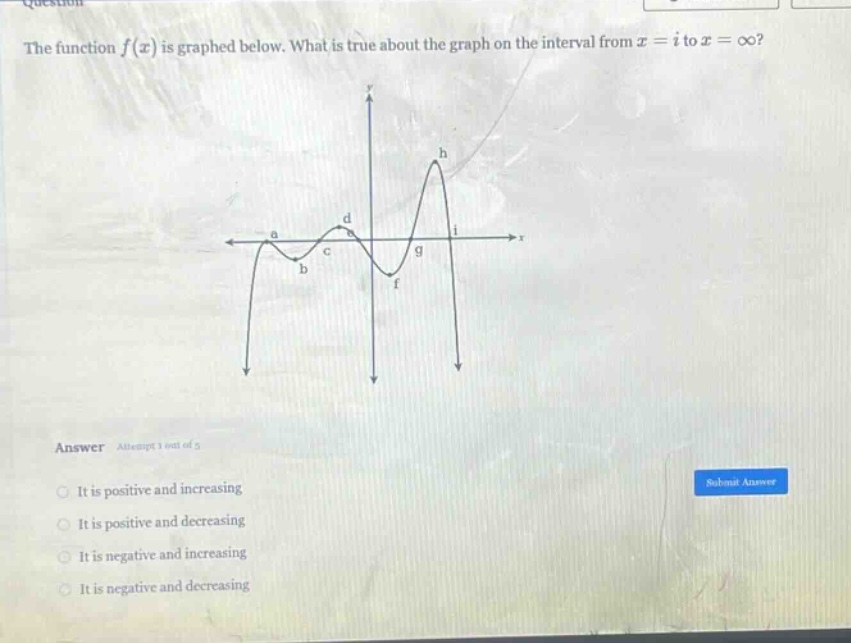
the function f(x) is graphed below. what is true about the graph on the interval from x = i to x = ∞? answer it is positive and increasing it is positive and decreasing it is negative and increasing it is negative and decreasing
Answer
Explanation:
Step1: Analyze y - values on interval
On the interval from (x = i) to (x=\infty), observe the position of the graph relative to the x - axis. The graph is below the x - axis, so (y=f(x)<0), which means the function is negative.
Step2: Analyze slope on interval
As (x) increases from (i) to (\infty), the graph is going downwards. A downward - sloping graph indicates a negative slope, so the function is decreasing.
Answer:
It is negative and decreasing