the function $f(x)$ is graphed below. what is true about the graph on the interval from point $d$ to point…
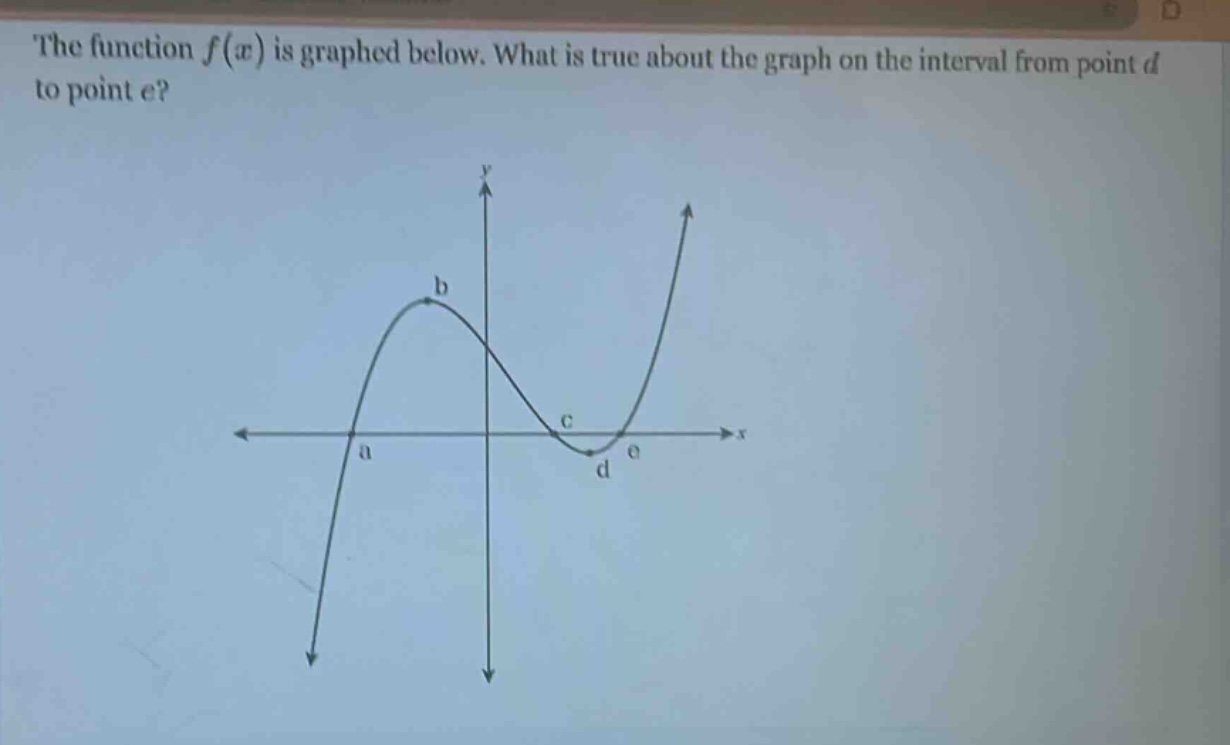
the function $f(x)$ is graphed below. what is true about the graph on the interval from point $d$ to point $e$?
Answer
Explanation:
Step1: Observe the graph
On the interval from point d to point e, as x - values increase from d to e, the y - values of the function f(x) are increasing.
Step2: Recall function behavior
A function is increasing on an interval if for any two points (x_1) and (x_2) in the interval with (x_1<x_2), then (f(x_1)<f(x_2)).
Answer:
The function (f(x)) is increasing on the interval from point d to point e.