the function $f(x)$ is graphed below. what is true about the graph on the interval from point $d$ to point…
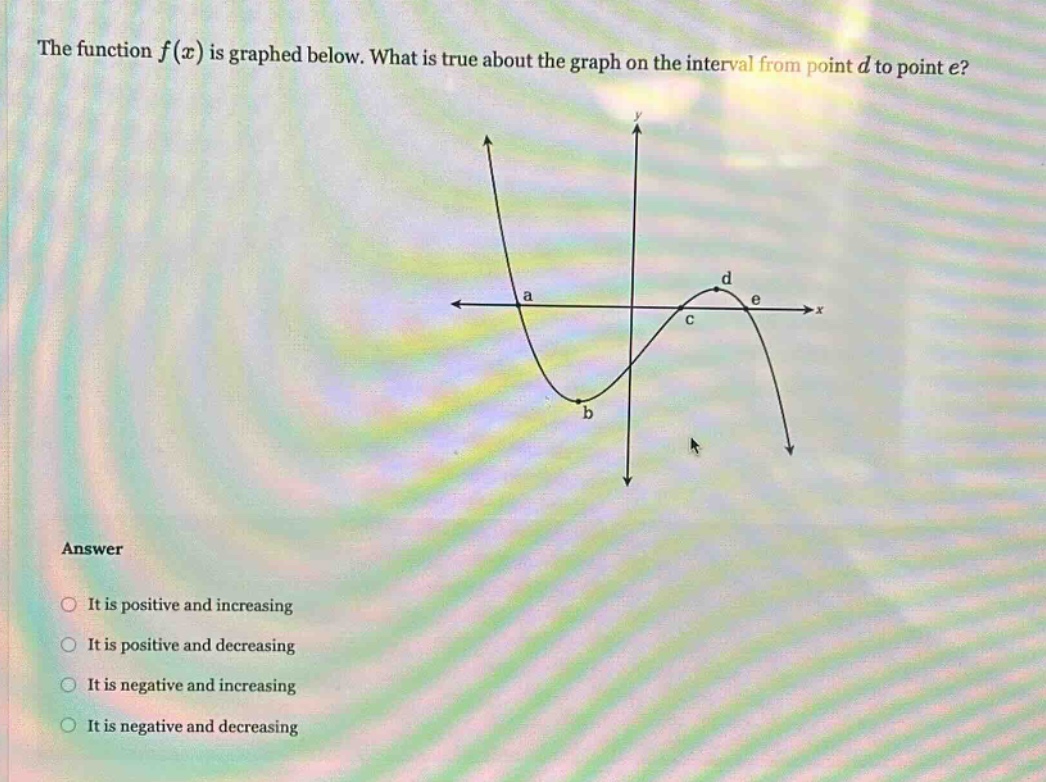
the function $f(x)$ is graphed below. what is true about the graph on the interval from point $d$ to point $e$?\nanswer\nit is positive and increasing\nit is positive and decreasing\nit is negative and increasing\nit is negative and decreasing
Answer
Explanation:
Step1: Analyze y - values on interval
On the interval from point $d$ to point $e$, the graph of the function $y = f(x)$ lies above the $x$-axis. So, $f(x)>0$ for all $x$ in the interval $(d,e)$, which means the function is positive.
Step2: Analyze slope on interval
As we move from left - to - right on the interval from point $d$ to point $e$, the $y$-values of the function are decreasing. The slope of the tangent line to the curve is negative on this interval, so the function is decreasing.
Answer:
It is positive and decreasing