the function, g(x), is plotted as shown. use the graph to determine the lim g(x) as x→3 3 2 dne 3.5
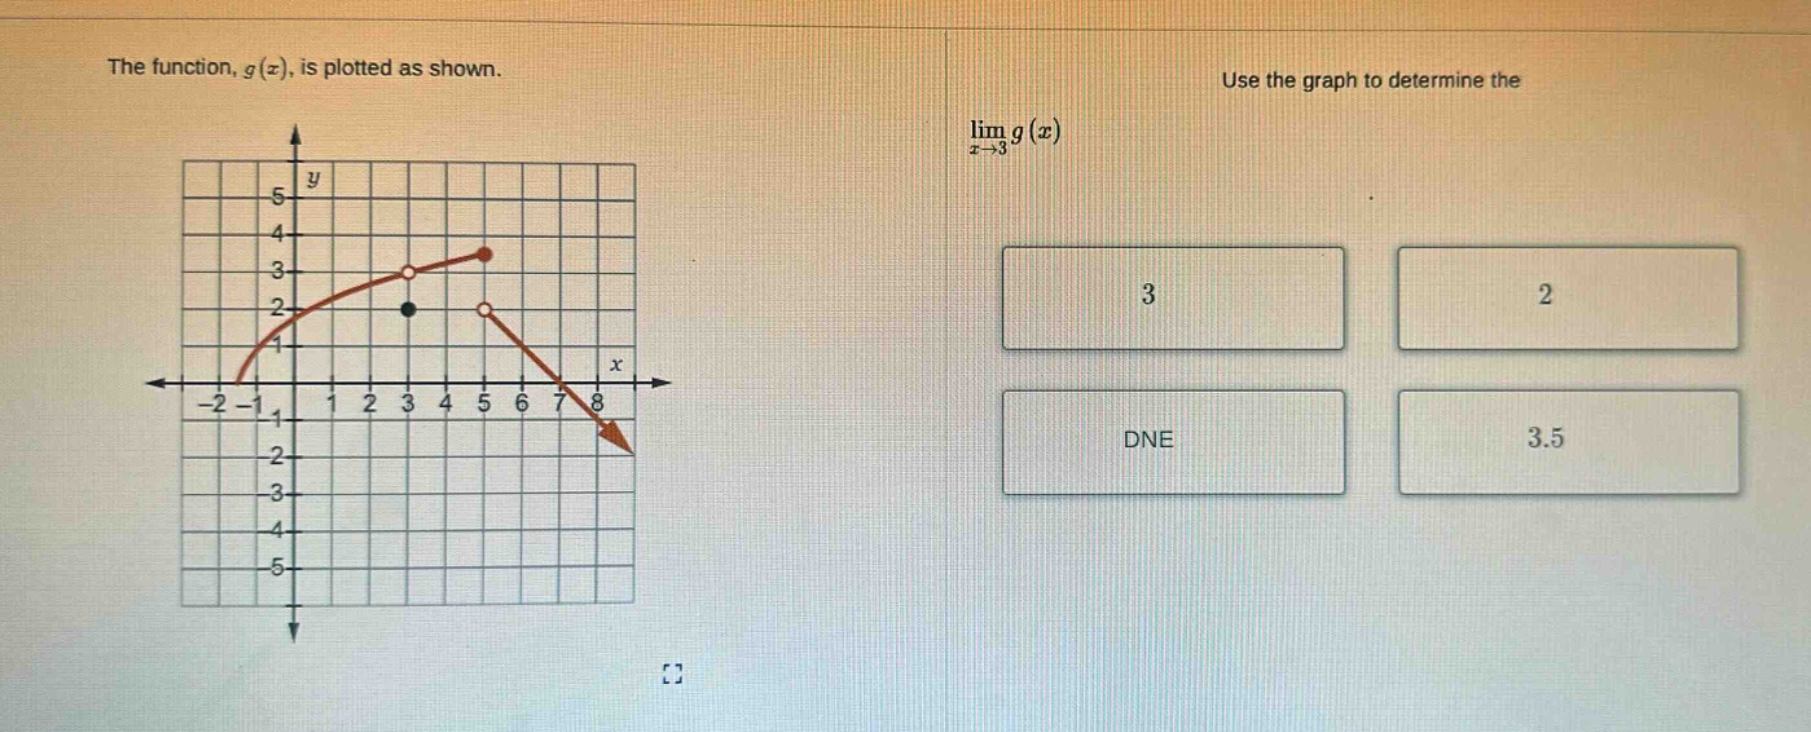
the function, g(x), is plotted as shown. use the graph to determine the lim g(x) as x→3 3 2 dne 3.5
Answer
Explanation:
Step1: Recall limit - definition
The limit $\lim_{x\rightarrow a}g(x)$ exists if the left - hand limit $\lim_{x\rightarrow a^{-}}g(x)$ and the right - hand limit $\lim_{x\rightarrow a^{+}}g(x)$ are equal.
Step2: Find left - hand limit
As $x$ approaches $3$ from the left ($x\rightarrow3^{-}$), we follow the graph of $y = g(x)$ for values of $x$ less than $3$. The $y$ - value approaches $3$.
Step3: Find right - hand limit
As $x$ approaches $3$ from the right ($x\rightarrow3^{+}$), we follow the graph of $y = g(x)$ for values of $x$ greater than $3$. The $y$ - value approaches $3$.
Answer:
3