which function is represented by the graph? y = sin(x - π/4) - 2 y = sin(x - π/4) + 2 y = cos(x + π/4) - 2 y…
which function is represented by the graph? y = sin(x - π/4) - 2 y = sin(x - π/4) + 2 y = cos(x + π/4) - 2 y = cos(x - π/4) - 2
Answer
Explanation:
Step1: Analyze vertical - shift
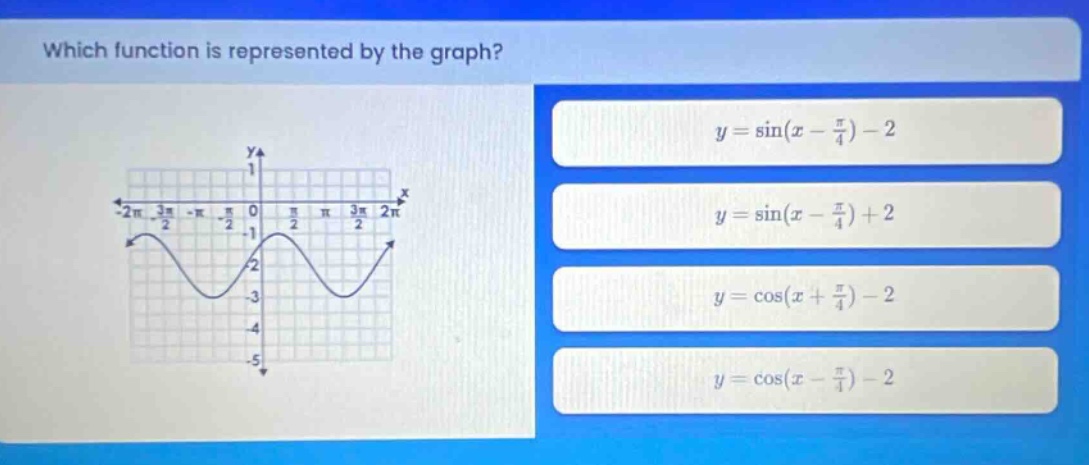
The mid - line of the sine and cosine functions is usually (y = 0). In the given graph, the mid - line is (y=-2), which means the function has a vertical shift of (d=-2). So we can eliminate the option (y=\sin(x - \frac{\pi}{4})+2).
Step2: Analyze phase - shift and function type
The general form of a sine function is (y = A\sin(B(x - C))+D) and for a cosine function is (y=A\cos(B(x - C))+D). The standard sine function (y = \sin x) passes through the origin ((0,0)) in its basic form. The standard cosine function (y=\cos x) has a maximum at (x = 0). Looking at the graph, it has a shape similar to a sine function. Also, we can check the phase - shift. For the remaining sine function (y=\sin(x-\frac{\pi}{4})-2), we can analyze its key points.
Answer:
(y=\sin(x - \frac{\pi}{4})-2)