a function is shown in the table below. on which interval of x is the average rate of change of the function…
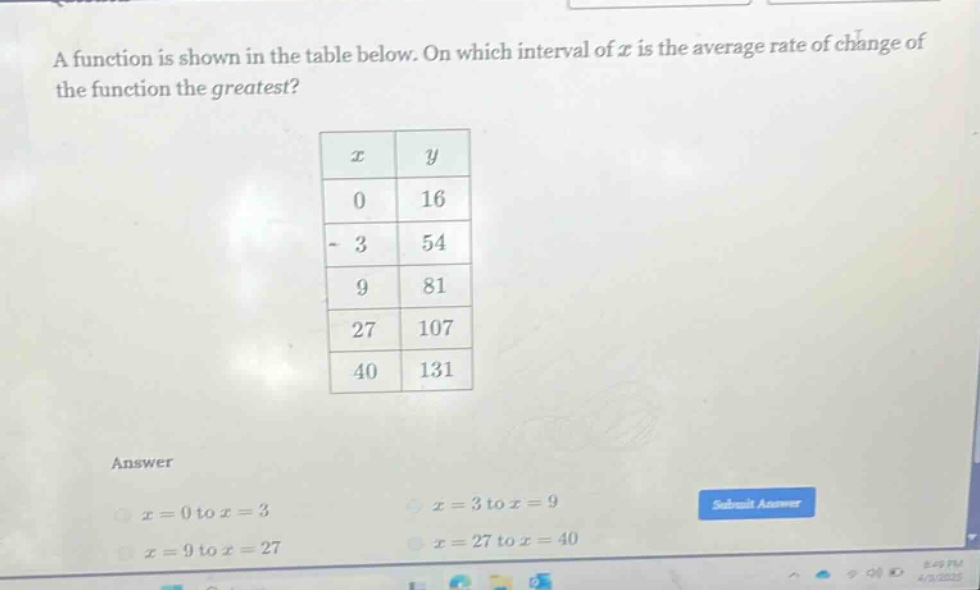
a function is shown in the table below. on which interval of x is the average rate of change of the function the greatest? x y 0 16 3 54 9 81 27 107 40 131 answer x = 0 to x = 3 x = 3 to x = 9 x = 9 to x = 27 x = 27 to x = 40
Answer
Explanation:
Step1: Recall average - rate - of - change formula
The average rate of change of a function $y = f(x)$ over the interval $[a,b]$ is $\frac{f(b)-f(a)}{b - a}$.
Step2: Calculate rate of change for $x = 0$ to $x = 3$
Here, $a = 0$, $b = 3$, $f(0)=16$, $f(3)=54$. The average rate of change is $\frac{54 - 16}{3-0}=\frac{38}{3}\approx12.67$.
Step3: Calculate rate of change for $x = 3$ to $x = 9$
Here, $a = 3$, $b = 9$, $f(3)=54$, $f(9)=81$. The average rate of change is $\frac{81 - 54}{9 - 3}=\frac{27}{6}=4.5$.
Step4: Calculate rate of change for $x = 9$ to $x = 27$
Here, $a = 9$, $b = 27$, $f(9)=81$, $f(27)=107$. The average rate of change is $\frac{107 - 81}{27 - 9}=\frac{26}{18}=\frac{13}{9}\approx1.44$.
Step5: Calculate rate of change for $x = 27$ to $x = 40$
Here, $a = 27$, $b = 40$, $f(27)=107$, $f(40)=131$. The average rate of change is $\frac{131 - 107}{40 - 27}=\frac{24}{13}\approx1.85$.
Answer:
$x = 0$ to $x = 3$