function h is shown in the xy - plane. function h is an image of a parent function that has undergone a…
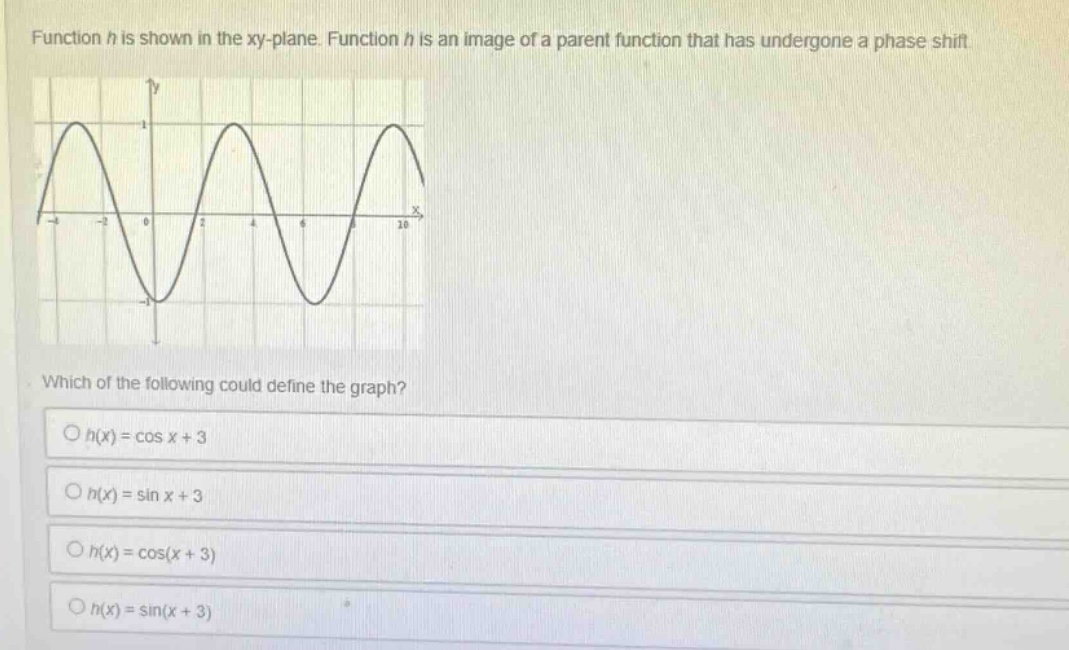
function h is shown in the xy - plane. function h is an image of a parent function that has undergone a phase shift. which of the following could define the graph? o h(x)=cos x + 3 o h(x)=sin x + 3 o h(x)=cos(x + 3) o h(x)=sin(x + 3)
Answer
Explanation:
Step1: Recall phase - shift formula
The general form of a function with a phase - shift is (y = f(x + c)) for a horizontal shift of (|c|) units (left if (c>0) and right if (c < 0)). The functions (h(x)=\cos x+3) and (h(x)=\sin x + 3) are vertical shifts (up by 3 units) of the parent functions (y = \cos x) and (y=\sin x) respectively, not phase - shifts.
Step2: Analyze cosine and sine phase - shift
For the cosine function (y=\cos(x)), its maximum value occurs at (x = 2k\pi,k\in\mathbb{Z}), and for the sine function (y = \sin(x)), its maximum value occurs at (x=\frac{\pi}{2}+2k\pi,k\in\mathbb{Z}). Looking at the graph, it appears to be a cosine - type function (since it has a maximum at (x = 0) for the un - shifted version). A phase - shift of the cosine function (y=\cos(x)) is of the form (y=\cos(x + c)).
Answer:
C. (h(x)=\cos(x + 3))