a government considers a single person as living in poverty if his or her income falls below the official…
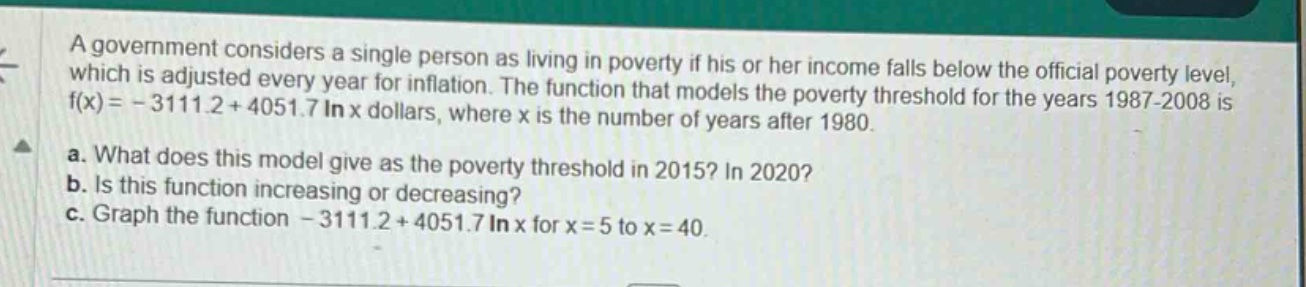
a government considers a single person as living in poverty if his or her income falls below the official poverty level, which is adjusted every year for inflation. the function that models the poverty threshold for the years 1987 - 2008 is f(x)= - 3111.2 + 4051.7 ln x dollars, where x is the number of years after 1980.\na. what does this model give as the poverty threshold in 2015? in 2020?\nb. is this function increasing or decreasing?\nc. graph the function - 3111.2 + 4051.7 ln x for x = 5 to x = 40.
Answer
Explanation:
Step1: Calculate x for 2015 and 2020
For 2015, $x = 2015 - 1980=35$. For 2020, $x = 2020 - 1980 = 40$.
Step2: Find poverty - threshold for 2015
Substitute $x = 35$ into $f(x)=-3111.2 + 4051.7\ln x$. $f(35)=-3111.2+4051.7\ln(35)$ $=-3111.2 + 4051.7\times3.555348$ $=-3111.2+14409.41$ $=11298.21$
Step3: Find poverty - threshold for 2020
Substitute $x = 40$ into $f(x)=-3111.2 + 4051.7\ln x$. $f(40)=-3111.2+4051.7\ln(40)$ $=-3111.2 + 4051.7\times3.688879$ $=-3111.2+14943.50$ $=11832.30$
Step4: Determine if the function is increasing or decreasing
The derivative of $y = f(x)=-3111.2 + 4051.7\ln x$ is $y^\prime=\frac{4051.7}{x}$. Since $x>0$ (as it represents the number of years after 1980) and $y^\prime=\frac{4051.7}{x}>0$ for all $x > 0$, the function is increasing.
Step5: Graphing (description)
To graph $y=-3111.2 + 4051.7\ln x$ for $x = 5$ to $x = 40$, we can calculate the $y$-values for several $x$-values in the interval $[5,40]$. For example, when $x = 5$, $y=-3111.2+4051.7\ln(5)=-3111.2 + 4051.7\times1.609438=-3111.2 + 6527.47=3416.27$. Plot these points and connect them with a smooth curve. The function has a vertical - asymptote at $x = 0$ (not in our domain of $x\in[5,40]$), and it is an increasing function.
Answer:
a. The poverty threshold in 2015 is approximately $$11298.21$ and in 2020 is approximately $$11832.30$. b. The function is increasing. c. Graph by calculating $y$-values for $x\in[5,40]$ and plotting points to form a smooth increasing curve.