which is the graph of y = 3sin(x) - 1?
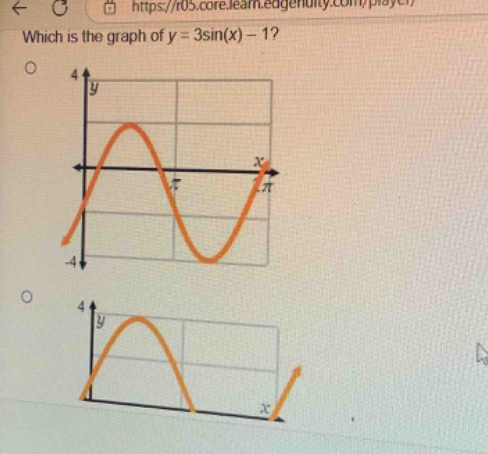
which is the graph of y = 3sin(x) - 1?
Answer
Answer:
We need to analyze the key - features of the function (y = 3\sin(x)-1) to determine its graph. The general form of a sine function is (y = A\sin(Bx - C)+D). For the function (y = 3\sin(x)-1), we have:
- Amplitude (|A|): Here (A = 3), so the amplitude is (3). This means the distance from the mid - line to the maximum or minimum of the sine wave is (3).
- Vertical shift (D): Here (D=- 1), so the mid - line of the sine wave is (y = - 1). The standard sine function (y=\sin(x)) has a mid - line at (y = 0), maximum value of (1) and minimum value of (-1). For (y = 3\sin(x)-1), the maximum value is (3\times1 - 1=2) and the minimum value is (3\times(-1)-1=-4). We can also find some key points: When (x = 0), (y=3\sin(0)-1=-1) When (x=\frac{\pi}{2}), (y = 3\sin(\frac{\pi}{2})-1=3 - 1 = 2) When (x=\pi), (y=3\sin(\pi)-1=-1) When (x=\frac{3\pi}{2}), (y=3\sin(\frac{3\pi}{2})-1=-3 - 1=-4) When (x = 2\pi), (y=3\sin(2\pi)-1=-1)
We would then compare these characteristics with the given graphs to select the one that has a mid - line at (y=-1), an amplitude of (3), and passes through the key points ((0, - 1),(\frac{\pi}{2},2),(\pi,-1),(\frac{3\pi}{2},-4),(2\pi,-1))
Since the graphs are not fully shown in the question, we can't give a definite choice from the options. But the steps above show how to analyze the function to identify its graph.
Explanation:
Step1: Identify amplitude
The coefficient of (\sin(x)) is (A = 3), so amplitude (|A| = 3).
Step2: Identify vertical shift
The constant term is (D=-1), so mid - line is (y=-1).
Step3: Find key points
Use (x = 0,\frac{\pi}{2},\pi,\frac{3\pi}{2},2\pi) and (y = 3\sin(x)-1) to find (y) - values.