graph 5a below.....extra credit if you graph 5b. make a cl\n5a) graph f(x) = 2sin x\n5b)\nmy chart\nx |…
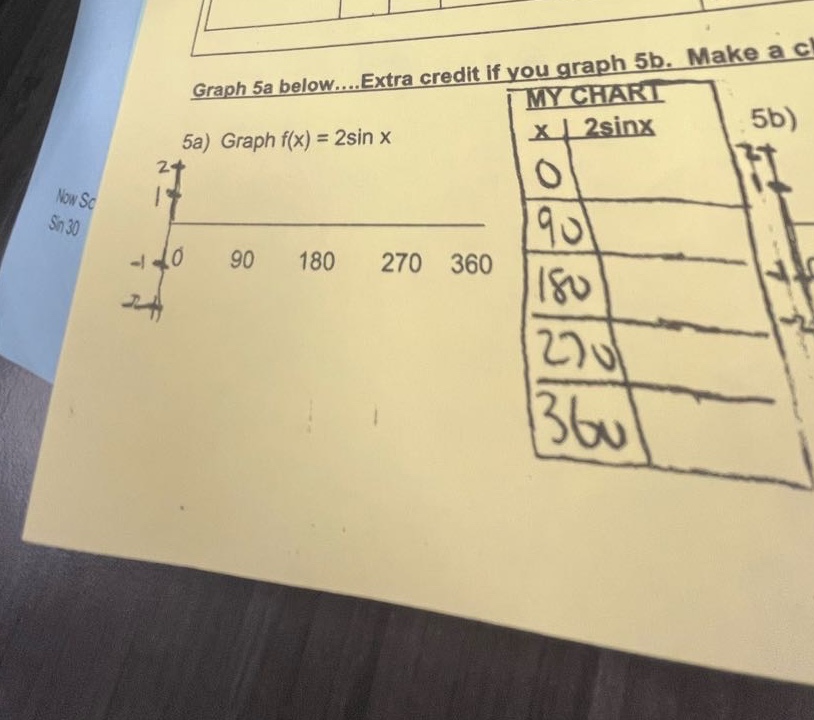
graph 5a below.....extra credit if you graph 5b. make a cl\n5a) graph f(x) = 2sin x\n5b)\nmy chart\nx | 2sinx\n0\n90\n180\n270\n360\nnow sc\nsin 30
Answer
Explanation:
Step1: Recall sine - value at 0
We know that $\sin(0)=0$. So when $x = 0$, $y=2\sin(0)=2\times0 = 0$.
Step2: Recall sine - value at 90°
Since $\sin(90^{\circ}) = 1$, when $x = 90^{\circ}$, $y=2\sin(90^{\circ})=2\times1 = 2$.
Step3: Recall sine - value at 180°
We know that $\sin(180^{\circ})=0$. So when $x = 180^{\circ}$, $y=2\sin(180^{\circ})=2\times0 = 0$.
Step4: Recall sine - value at 270°
Since $\sin(270^{\circ})=-1$, when $x = 270^{\circ}$, $y=2\sin(270^{\circ})=2\times(-1)=-2$.
Step5: Recall sine - value at 360°
We know that $\sin(360^{\circ}) = 0$. So when $x = 360^{\circ}$, $y=2\sin(360^{\circ})=2\times0 = 0$.
The completed table:
| $x$ | $2\sin x$ |
|---|---|
| $0$ | $0$ |
| $90$ | $2$ |
| $180$ | $0$ |
| $270$ | $-2$ |
| $360$ | $0$ |
To graph $y = 2\sin x$:
- Mark the points $(0,0),(90,2),(180,0),(270, - 2),(360,0)$ on the coordinate - plane where the $x$ - axis is in degrees and the $y$ - axis represents the value of $y = 2\sin x$.
- Connect these points with a smooth curve. The curve will be a periodic wave with an amplitude of 2 (the maximum and minimum values of the function are 2 and - 2 respectively) and a period of $360^{\circ}$ (it repeats every $360^{\circ}$).
Answer:
The completed table is shown above and the graph is a sine - wave with amplitude 2 and period 360° passing through the points $(0,0),(90,2),(180,0),(270, - 2),(360,0)$.