which graph has an average rate of change of approximately -1 over the interval -2, 6?
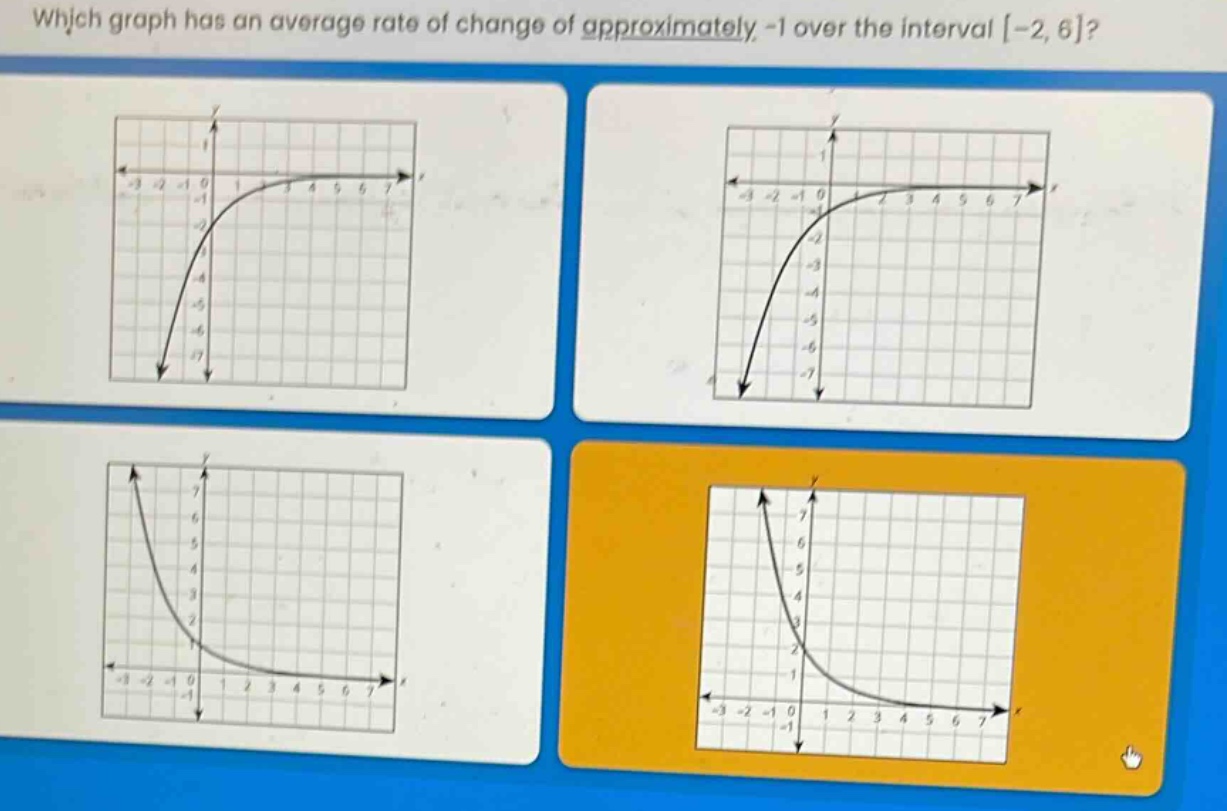
which graph has an average rate of change of approximately -1 over the interval -2, 6?
Answer
Explanation:
Step1: Recall average - rate - of - change formula
The average rate of change of a function $y = f(x)$ over the interval $[a,b]$ is given by $\frac{f(b)-f(a)}{b - a}$. Here, $a=-2$, $b = 6$, so $\frac{f(6)-f(-2)}{6-(-2)}=\frac{f(6)-f(-2)}{8}$. We want this value to be approximately $- 1$, so $f(6)-f(-2)\approx - 8$.
Step2: Analyze each graph
For each graph, estimate the $y$ - values at $x=-2$ and $x = 6$.
- For the first graph: Estimate $y$ - values. Let's assume $f(-2)\approx - 6$ and $f(6)\approx0$. Then $f(6)-f(-2)=0-(-6)=6$.
- For the second graph: Assume $f(-2)\approx - 7$ and $f(6)\approx - 1$. Then $f(6)-f(-2)=-1-(-7)=6$.
- For the third graph: Assume $f(-2)\approx7$ and $f(6)\approx - 1$. Then $f(6)-f(-2)=-1 - 7=-8$.
- For the fourth graph: Assume $f(-2)\approx6$ and $f(6)\approx0$. Then $f(6)-f(-2)=0 - 6=-6$.
Answer:
The third graph.