which is the graph of y = cos(x) + 3?
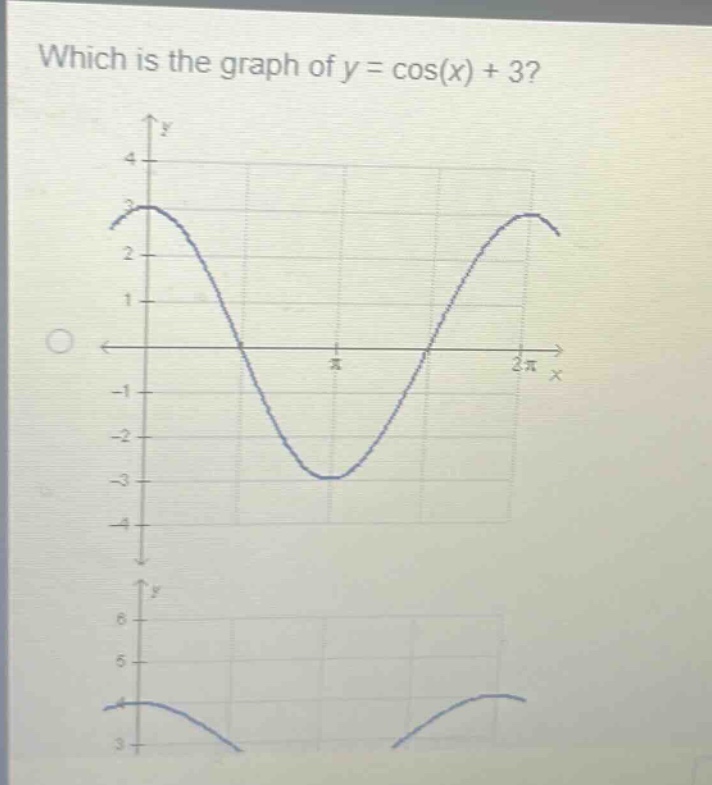
which is the graph of y = cos(x) + 3?
Answer
Answer:
The graph of (y = \cos(x)+3) is the graph of (y = \cos(x)) shifted upwards by 3 units. The range of (y=\cos(x)) is ([- 1,1]), and for (y=\cos(x)+3) the range is ([2,4]). When (x = 0), (y=\cos(0)+3=1 + 3=4); when (x=\pi), (y=\cos(\pi)+3=-1 + 3=2); when (x = 2\pi), (y=\cos(2\pi)+3=1+3=4). So the correct graph is the one where the cosine - wave has a mid - line at (y = 3), maximum value at (y = 4) and minimum value at (y = 2). (Since no options are labeled, we can't pick a specific option from the given images, but describe the characteristics).
Explanation:
Step1: Recall cosine function properties
The basic cosine function is (y=\cos(x)) with range ([-1,1]).
Step2: Analyze vertical shift
For (y = f(x)+k), if (k>0), the graph of (y = f(x)) is shifted upwards by (k) units. Here (f(x)=\cos(x)) and (k = 3), so the range of (y=\cos(x)+3) is ([-1 + 3,1+3]=[2,4]).
Step3: Find key points
Evaluate at (x = 0,\pi,2\pi). When (x = 0), (y=\cos(0)+3=4); when (x=\pi), (y=\cos(\pi)+3=2); when (x = 2\pi), (y=\cos(2\pi)+3=4).