which is the graph of y = cos(x - π)?
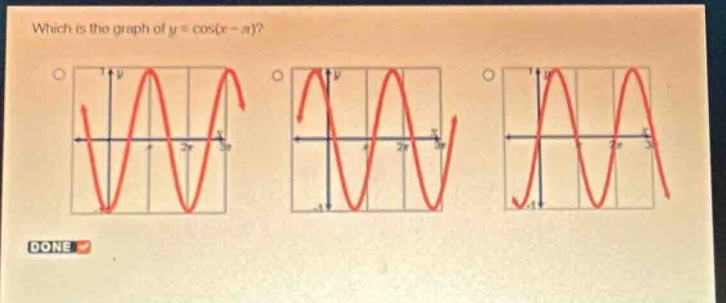
which is the graph of y = cos(x - π)?
Answer
Answer:
The graph of (y = \cos(x-\pi)) is the same as (y=-\cos x) due to the cosine - angle subtraction formula (\cos(A - B)=\cos A\cos B+\sin A\sin B). When (A = x) and (B=\pi), we have (\cos(x-\pi)=\cos x\cos\pi+\sin x\sin\pi). Since (\cos\pi=- 1) and (\sin\pi = 0), then (\cos(x - \pi)=-\cos x). The graph of (y = \cos x) has a maximum at (x = 0) and (y=1), while the graph of (y=-\cos x) has a minimum at (x = 0) and (y=-1).
Explanation:
Step1: Apply cosine - angle subtraction formula
(\cos(x-\pi)=\cos x\cos\pi+\sin x\sin\pi)
Step2: Substitute values of trigonometric functions
Since (\cos\pi=-1) and (\sin\pi = 0), we get (\cos(x-\pi)=-\cos x)
Step3: Analyze the graph of (y =-\cos x)
The graph of (y = \cos x) has a maximum at (x = 0,y = 1). The graph of (y=-\cos x) is a reflection of (y = \cos x) about the (x) - axis, so it has a minimum at (x = 0,y=-1).