this graph displays a linear function. interpret the constant rate of change of the relationship. rate of…
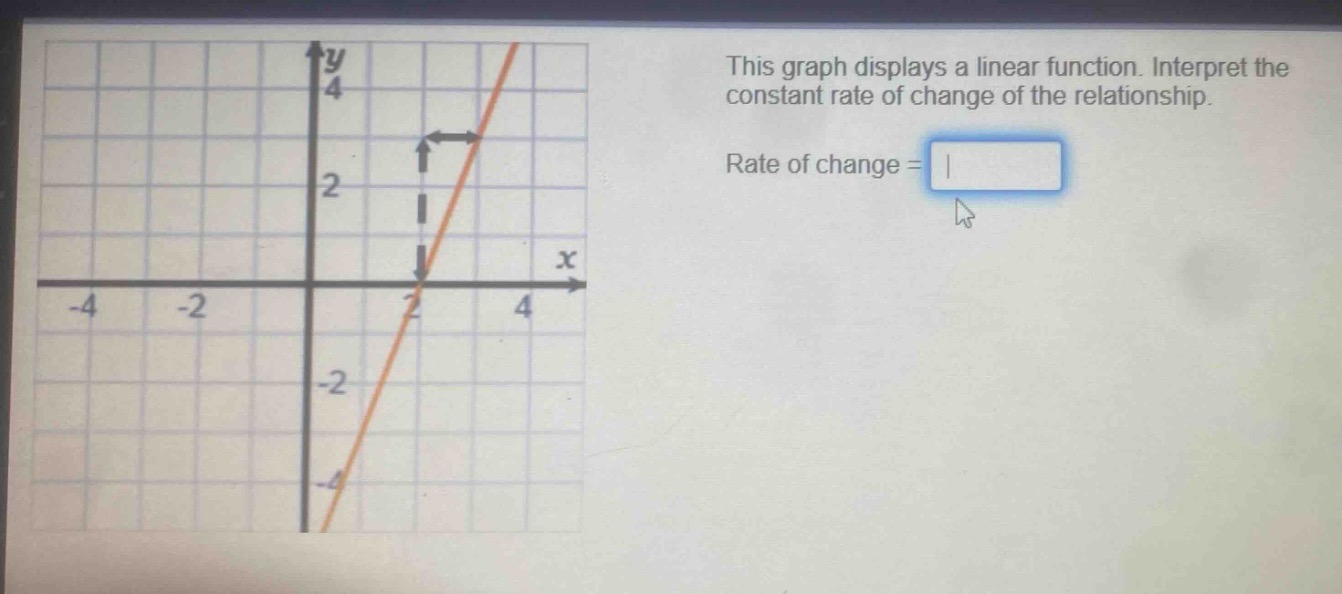
this graph displays a linear function. interpret the constant rate of change of the relationship. rate of change =
Answer
Answer:
(3)
Explanation:
Step1: Identify rise and run
From the graph, the rise (change in (y)) is (3) units and the run (change in (x)) is (1) unit.
Step2: Calculate rate of change
The formula for rate of change (slope) is (m=\frac{\text{rise}}{\text{run}}). Substituting the values, we get (m = \frac{3}{1}=3).