8. the graph displays the weekly u.s. average regular retail gasoline price since 2014. a) what is the range…
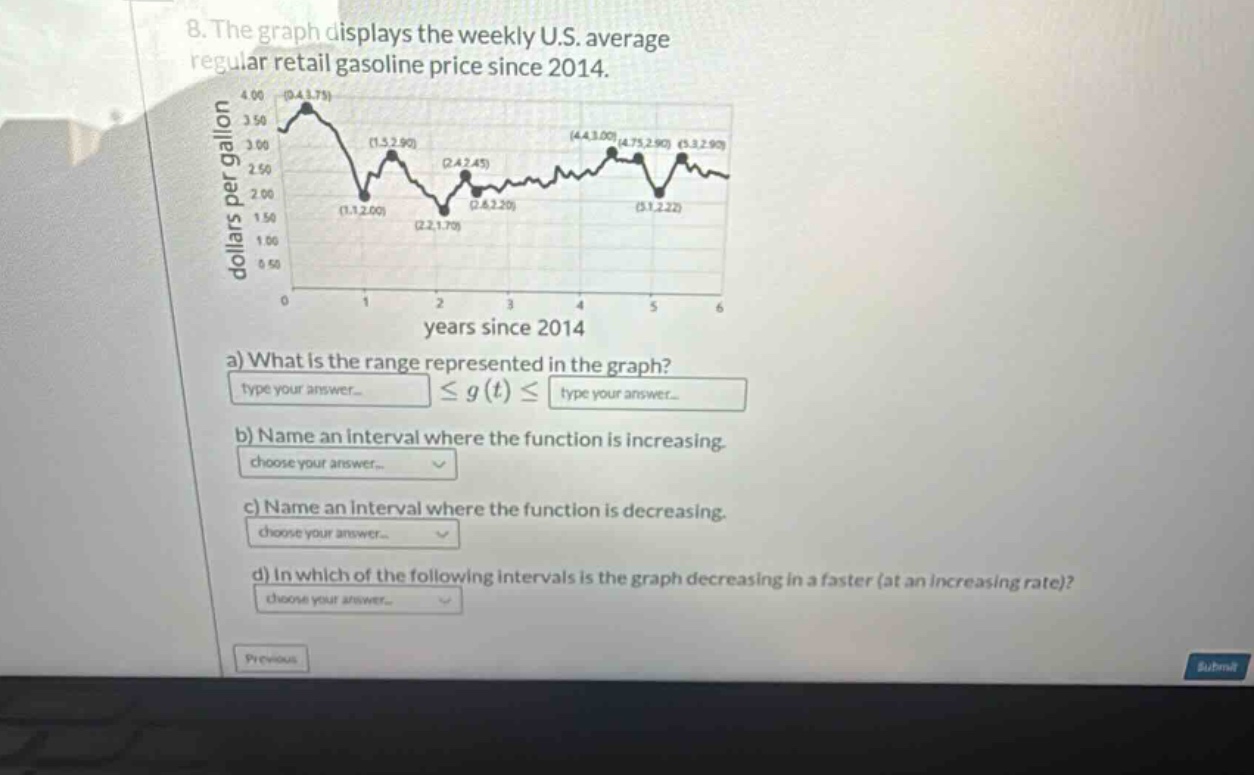
8. the graph displays the weekly u.s. average regular retail gasoline price since 2014. a) what is the range represented in the graph? type your answer... ≤ g(t) ≤ type your answer... b) name an interval where the function is increasing. choose your answer... c) name an interval where the function is decreasing. choose your answer... d) in which of the following intervals is the graph decreasing in a faster (at an increasing rate)? choose your answer...
Answer
Explanation:
Step1: Find the range
The lowest point on the graph has a y - value of approximately $1.70$ and the highest point has a y - value of approximately $3.75$. So the range is $1.70\leq g(t)\leq3.75$.
Step2: Find increasing interval
By observing the graph, the function is increasing from year $2.2$ to year $2.4$. So an increasing interval is $(2.2, 2.4)$.
Step3: Find decreasing interval
The function is decreasing from year $0.4$ to year $1.1$. So a decreasing interval is $(0.4, 1.1)$.
Step4: Find fastest - decreasing interval
The slope of the graph is steeper (more negative) from year $0.4$ to year $1.1$ compared to other decreasing intervals. So the interval where the graph is decreasing at an increasing rate is $(0.4, 1.1)$.
Answer:
a) $1.70$, $3.75$ b) $(2.2, 2.4)$ c) $(0.4, 1.1)$ d) $(0.4, 1.1)$