graph the equation shown below by transforming the given graph of the parent function. \n$y = 2x^2$
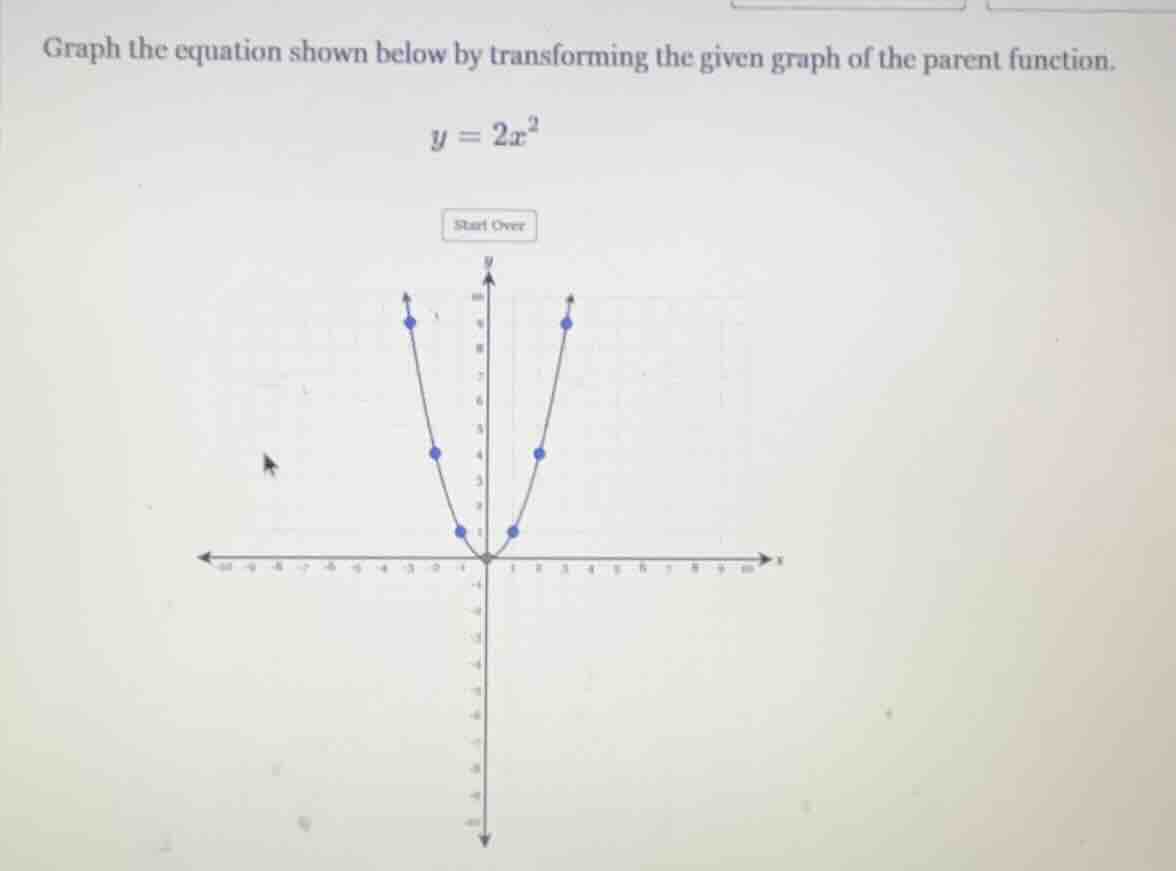
graph the equation shown below by transforming the given graph of the parent function. \n$y = 2x^2$
Answer
Explanation:
Step1: Identify the parent function
The parent function for a quadratic function is ( y = x^2 ), which is a parabola opening upwards with vertex at the origin ((0,0)).
Step2: Analyze the transformation for ( y = 2x^2 )
For a function of the form ( y = a x^2 ), the value of ( a ) affects the vertical stretch or compression of the parent function ( y = x^2 ). If ( |a|>1 ), the graph is vertically stretched (narrower) compared to the parent function. Here, ( a = 2 ), so we need to vertically stretch the graph of ( y = x^2 ) by a factor of 2.
Step3: Determine key points transformation
- For the parent function ( y = x^2 ), when ( x = 0 ), ( y = 0 ); when ( x = 1 ), ( y = 1 ); when ( x = 2 ), ( y = 4 ); when ( x = 3 ), ( y = 9 ), etc.
- For ( y = 2x^2 ), when ( x = 0 ), ( y = 2(0)^2=0 ) (vertex remains at ((0,0))). When ( x = 1 ), ( y = 2(1)^2 = 2 ); when ( x = 2 ), ( y = 2(2)^2=8 ); when ( x = 3 ), ( y = 2(3)^2 = 18 ), etc. But looking at the given graph, the points plotted seem to be for ( x=\pm1,\pm2,\pm3 ) with ( y ) values as per ( y = 2x^2 ) (e.g., at ( x = 1 ), ( y = 2 ); ( x = 2 ), ( y = 8 ); ( x = 3 ), ( y = 18 ) but in the graph, the top points are at ( x=\pm3 ), ( y = 18 )? Wait, no, the graph in the image has points at ( x=\pm1 ) (y=2?), ( x=\pm2 ) (y=8?), ( x=\pm3 ) (y=18?) but the y-axis is labeled with numbers. Wait, maybe the graph is already showing the transformed graph. But the process is: take the parent graph ( y = x^2 ), and for each ( x )-value, multiply the ( y )-value by 2 to get the corresponding point on ( y = 2x^2 ). So the vertex stays at ((0,0)), and the parabola is narrower (vertically stretched) because the coefficient 2 is greater than 1.
Step4: Sketch the transformed graph
Plot the vertex at ((0,0)). Then, for ( x = 1 ), plot ((1, 2)); for ( x = - 1 ), plot ((-1, 2)); for ( x = 2 ), plot ((2, 8)); for ( x = - 2 ), plot ((-2, 8)); for ( x = 3 ), plot ((3, 18)); for ( x = - 3 ), plot ((-3, 18)), etc. Connect these points with a smooth curve, which will be a parabola opening upwards, narrower than ( y = x^2 ), with vertex at the origin.
Answer:
To graph ( y = 2x^2 ) from the parent function ( y = x^2 ):
- Vertex: Remains at ((0,0)) (since there is no horizontal/vertical shift).
- Vertical Stretch: The graph of ( y = x^2 ) is vertically stretched by a factor of 2 (because ( a = 2 > 1 )). For each ( x )-value, the ( y )-value of ( y = x^2 ) is multiplied by 2.
- Key Points: Plot ((0,0)), ((\pm1, 2)), ((\pm2, 8)), ((\pm3, 18)), etc., and draw a smooth, upward - opening parabola through these points (narrower than ( y = x^2 )).