6 (a) graph both equations on the same graph: equation 1: $y = 2x + 5$ equation 2: $y = -2x - 3$
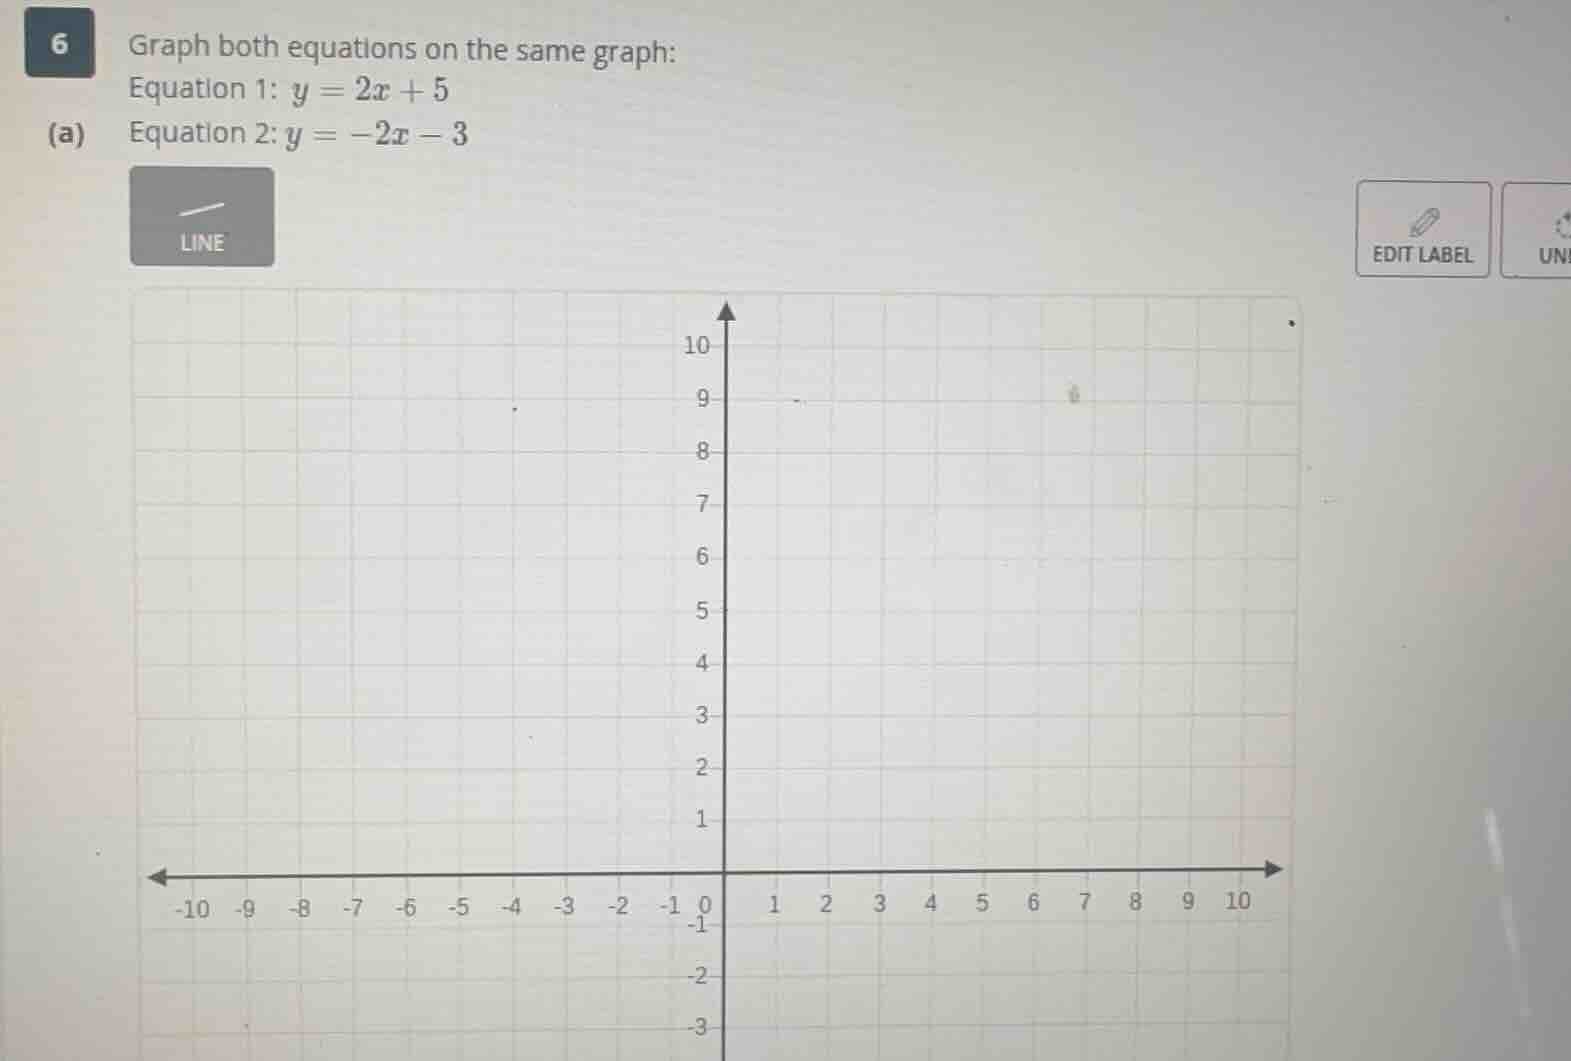
6 (a) graph both equations on the same graph: equation 1: $y = 2x + 5$ equation 2: $y = -2x - 3$
Answer
Explanation:
Step1: Graph ( y = 2x + 5 )
To graph a linear equation in slope - intercept form ( y=mx + b ) (where ( m ) is the slope and ( b ) is the y - intercept), for the equation ( y = 2x+5 ), the y - intercept ( b = 5 ). So we start by plotting the point ( (0,5) ) on the y - axis. The slope ( m = 2=\frac{2}{1} ), which means from the point ( (0,5) ), we move 2 units up (since the numerator of the slope is positive) and 1 unit to the right (since the denominator of the slope is positive). We can also find another point by substituting ( x = 1 ) into the equation: ( y=2(1)+5 = 7 ), so the point ( (1,7) ) is also on the line. We can draw a line through the points ( (0,5) ) and ( (1,7) ) (and other points we can find) to represent the equation ( y = 2x + 5 ).
Step2: Graph ( y=-2x - 3 )
For the equation ( y=-2x - 3 ), which is also in slope - intercept form ( y = mx + b ), the y - intercept ( b=-3 ). So we plot the point ( (0,-3) ) on the y - axis. The slope ( m=-2=\frac{-2}{1} ), which means from the point ( (0,-3) ), we move 2 units down (since the numerator of the slope is negative) and 1 unit to the right (since the denominator of the slope is positive). We can also find another point by substituting ( x = 1 ) into the equation: ( y=-2(1)-3=-5 ), so the point ( (1, - 5) ) is on the line. We can draw a line through the points ( (0,-3) ) and ( (1,-5) ) (and other points we can find) to represent the equation ( y=-2x - 3 ).
(Note: Since this is a graphing problem, the final answer is the graph with both lines plotted. The first line ( y = 2x+5 ) has a positive slope and passes through ( (0,5) ), ( (1,7) ), etc. The second line ( y=-2x - 3 ) has a negative slope and passes through ( (0,-3) ), ( (1,-5) ), etc.)
Answer:
The graph of ( y = 2x + 5 ) is a line with a slope of 2 and y - intercept 5. The graph of ( y=-2x - 3 ) is a line with a slope of - 2 and y - intercept - 3. When plotted on the same coordinate plane, the first line rises from left to right and the second line falls from left to right.