graph the exponential function.\n\\( g(x) = -\frac{3}{2}(2)^x \\)\nplot five points on the graph of the…
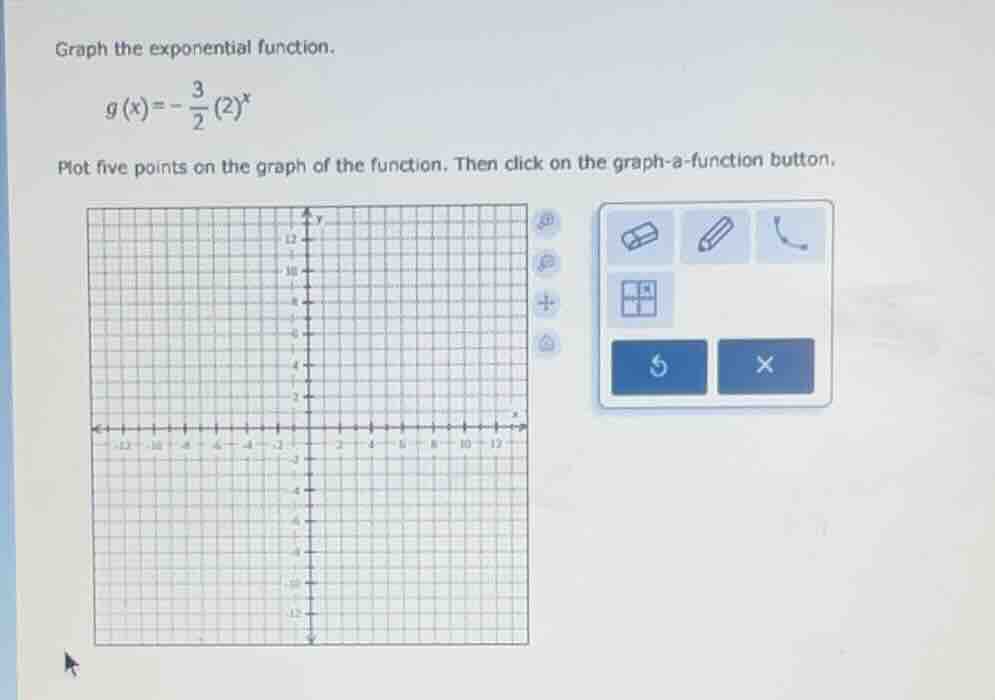
graph the exponential function.\n\\( g(x) = -\frac{3}{2}(2)^x \\)\nplot five points on the graph of the function. then click on the graph - a - function button.
Answer
Explanation:
Step1: Choose x-values
We can choose x - values such as (x=-2, - 1,0,1,2) to find corresponding y - values (since exponential functions are defined for all real numbers, these x - values will give us a good sense of the graph).
Step2: Calculate (g(x)) for (x = - 2)
Substitute (x=-2) into (g(x)=-\frac{3}{2}(2)^{x}). We know that (2^{-2}=\frac{1}{2^{2}}=\frac{1}{4}). So (g(-2)=-\frac{3}{2}\times2^{-2}=-\frac{3}{2}\times\frac{1}{4}=-\frac{3}{8}=-0.375)
Step3: Calculate (g(x)) for (x=-1)
Substitute (x = - 1) into (g(x)=-\frac{3}{2}(2)^{x}). We know that (2^{-1}=\frac{1}{2}). So (g(-1)=-\frac{3}{2}\times2^{-1}=-\frac{3}{2}\times\frac{1}{2}=-\frac{3}{4}=-0.75)
Step4: Calculate (g(x)) for (x = 0)
Substitute (x = 0) into (g(x)=-\frac{3}{2}(2)^{x}). We know that (2^{0}=1). So (g(0)=-\frac{3}{2}\times2^{0}=-\frac{3}{2}\times1 = -\frac{3}{2}=-1.5)
Step5: Calculate (g(x)) for (x = 1)
Substitute (x = 1) into (g(x)=-\frac{3}{2}(2)^{x}). We know that (2^{1}=2). So (g(1)=-\frac{3}{2}\times2^{1}=-\frac{3}{2}\times2=-3)
Step6: Calculate (g(x)) for (x = 2)
Substitute (x = 2) into (g(x)=-\frac{3}{2}(2)^{x}). We know that (2^{2}=4). So (g(2)=-\frac{3}{2}\times2^{2}=-\frac{3}{2}\times4=-6)
The five points are ((-2,-0.375)), ((-1, - 0.75)), ((0,-1.5)), ((1,-3)), ((2,-6)). To graph the function, we plot these points and draw a smooth curve through them (since it's an exponential function, the curve will have the characteristic shape of an exponential function, reflected over the x - axis (because of the negative sign) and vertically stretched by a factor of (\frac{3}{2})).
Answer:
The five points to plot are ((-2,-\frac{3}{8})), ((-1,-\frac{3}{4})), ((0,-\frac{3}{2})), ((1, - 3)), ((2,-6)) (or in decimal form ((-2,-0.375)), ((-1,-0.75)), ((0,-1.5)), ((1,-3)), ((2,-6))) and the graph is a smooth curve passing through these points with the general shape of an exponential function, reflected over the x - axis and vertically stretched.