what is the graph of the following function?\n$y = \\frac{1}{2} cdot \\cos \\frac{\\theta}{3}-2$
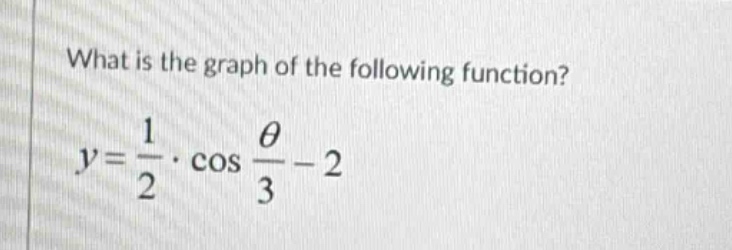
what is the graph of the following function?\n$y = \\frac{1}{2} cdot \\cos \\frac{\\theta}{3}-2$
Answer
Explanation:
Step1: Identify the amplitude
The general form of a cosine - function is $y = A\cos(B\theta)+C$. For the function $y=\frac{1}{2}\cos\frac{\theta}{3}-2$, the amplitude $A$ is given by the absolute value of the coefficient of the cosine term. Here, $A = \frac{1}{2}$.
Step2: Identify the period
The period of a cosine function $y=\cos(B\theta)$ is $T=\frac{2\pi}{|B|}$. For the function $y = \frac{1}{2}\cos\frac{\theta}{3}-2$, where $B=\frac{1}{3}$, the period $T=\frac{2\pi}{\frac{1}{3}}=6\pi$.
Step3: Identify the vertical shift
The vertical - shift of the function $y = A\cos(B\theta)+C$ is given by $C$. For the function $y=\frac{1}{2}\cos\frac{\theta}{3}-2$, the vertical shift $C=-2$.
The graph of $y = \frac{1}{2}\cos\frac{\theta}{3}-2$ is a cosine wave with an amplitude of $\frac{1}{2}$, a period of $6\pi$, and a vertical shift of $- 2$ units down from the standard cosine function $y = \cos\theta$.
Answer:
A cosine wave with amplitude $\frac{1}{2}$, period $6\pi$, and vertical shift of $2$ units down.