graph: $y < \\frac{1}{3}x + \\frac{1}{2}$\nclick or tap the graph to plot a point.
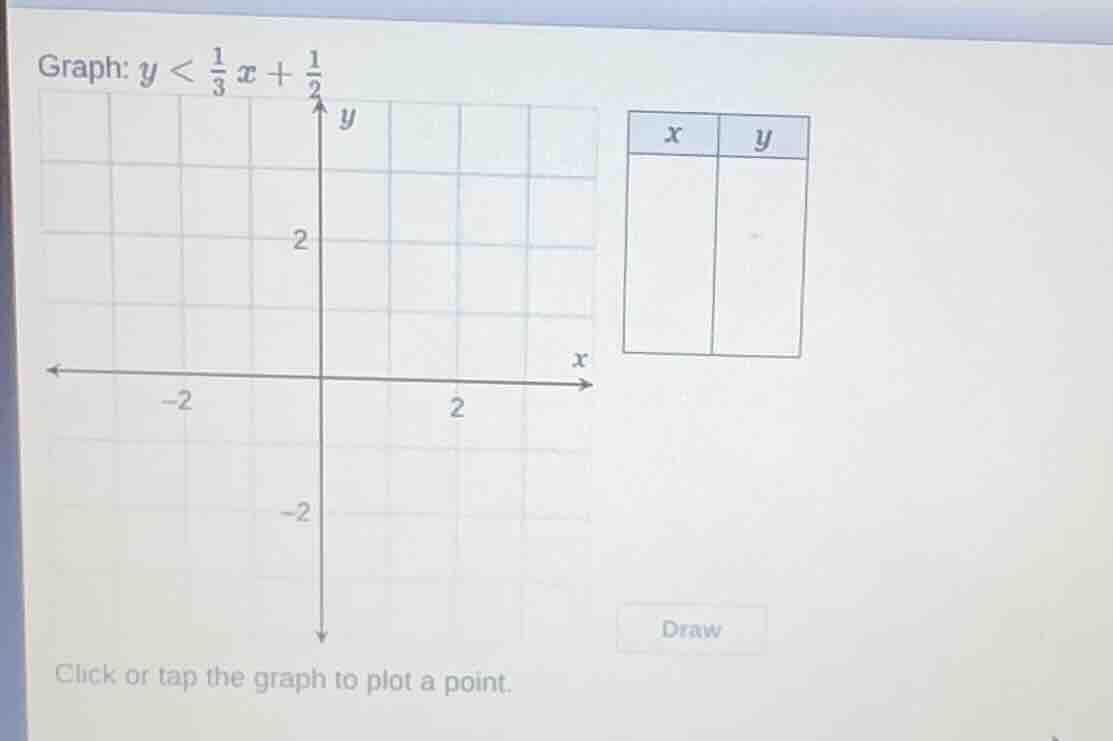
graph: $y < \\frac{1}{3}x + \\frac{1}{2}$\nclick or tap the graph to plot a point.
Answer
Explanation:
Step1: Identify the boundary line
The inequality is ( y < \frac{1}{3}x + \frac{1}{2} ). The boundary line is ( y = \frac{1}{3}x + \frac{1}{2} ), which is a straight line with slope ( \frac{1}{3} ) and y-intercept ( \frac{1}{2} ). Since the inequality is ( < ), the line should be dashed.
Step2: Choose a test point
A common test point is the origin ( (0,0) ). Substitute ( x = 0 ) and ( y = 0 ) into the inequality: ( 0 < \frac{1}{3}(0) + \frac{1}{2} ) ( 0 < \frac{1}{2} ), which is true. So we shade the region that includes the origin.
Step3: Plot the boundary line
- Find two points on the line ( y = \frac{1}{3}x + \frac{1}{2} ).
- When ( x = 0 ), ( y = \frac{1}{2} ), so the point is ( (0, \frac{1}{2}) ).
- When ( x = 3 ), ( y = \frac{1}{3}(3) + \frac{1}{2} = 1 + \frac{1}{2} = \frac{3}{2} ), so the point is ( (3, \frac{3}{2}) ).
- Draw a dashed line through these two points.
Step4: Shade the region
Since the test point ( (0,0) ) satisfies the inequality, shade the region below the dashed line (because ( y < ) the line).
For the table, we can choose some x-values and find the corresponding y-values on the boundary line (even though the inequality is strict, the table can help plot the line):
- When ( x = -3 ), ( y = \frac{1}{3}(-3) + \frac{1}{2} = -1 + \frac{1}{2} = -\frac{1}{2} )
- When ( x = 0 ), ( y = \frac{1}{2} )
- When ( x = 3 ), ( y = \frac{3}{2} )
So the table can be:
| x | y |
|---|---|
| -3 | -1/2 |
| 0 | 1/2 |
| 3 | 3/2 |
Answer:
To graph ( y < \frac{1}{3}x + \frac{1}{2} ):
- Draw a dashed line for ( y = \frac{1}{3}x + \frac{1}{2} ) (using points like ( (0, \frac{1}{2}) ) and ( (3, \frac{3}{2}) )).
- Shade the region below the dashed line (since ( (0,0) ) satisfies ( y < \frac{1}{3}x + \frac{1}{2} )).
The table (for the boundary line) is:
| x | y |
|---|---|
| -3 | -1/2 |
| 0 | 1/2 |
| 3 | 3/2 |