graph the function.\n11) y = \\frac{3}{4} \\sin(x + \\frac{\\pi}{2})
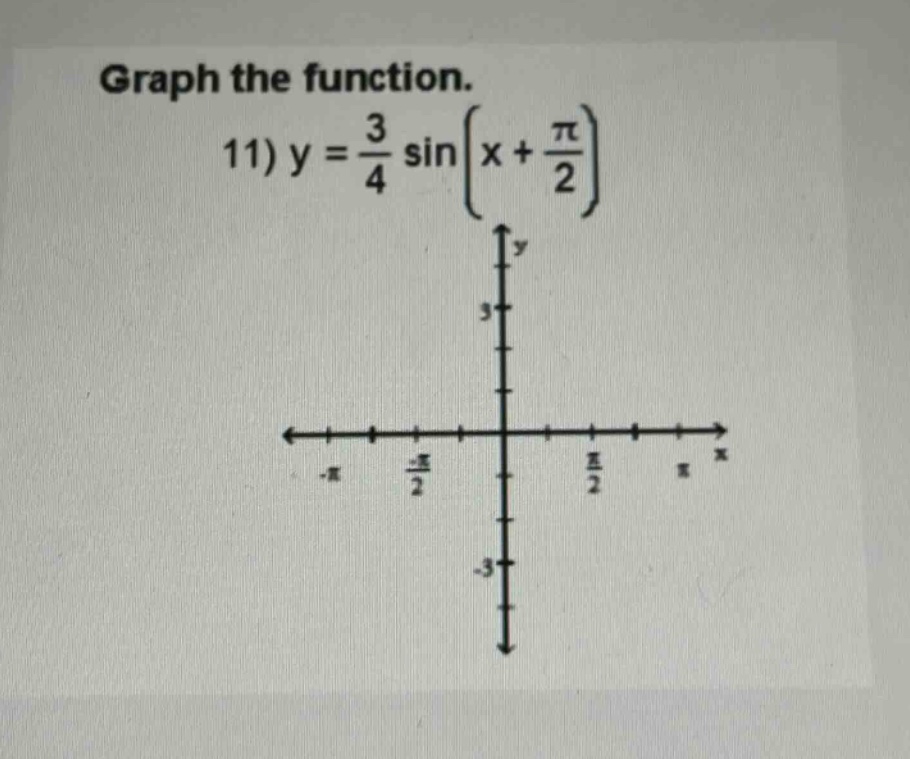
graph the function.\n11) y = \\frac{3}{4} \\sin(x + \\frac{\\pi}{2})
Answer
Explanation:
Step1: Identify the amplitude
The general form of a sine - function is $y = A\sin(Bx - C)+D$. For the function $y=\frac{3}{4}\sin(x + \frac{\pi}{2})$, the amplitude $|A|=\frac{3}{4}$. This means the maximum value of the function is $\frac{3}{4}$ and the minimum value is $-\frac{3}{4}$.
Step2: Identify the phase - shift
The phase - shift of the sine function $y = A\sin(Bx - C)+D$ is given by $\frac{C}{B}$. For the function $y=\frac{3}{4}\sin(x+\frac{\pi}{2})$, where $B = 1$ and $C=-\frac{\pi}{2}$, the phase - shift is $-\frac{\pi}{2}$. This means the graph of $y = \sin(x)$ is shifted to the left by $\frac{\pi}{2}$ units.
Step3: Find key points
For the basic sine function $y=\sin(x)$, key points are $(0,0),(\frac{\pi}{2},1),(\pi,0),(\frac{3\pi}{2}, - 1),(2\pi,0)$. For the function $y=\frac{3}{4}\sin(x+\frac{\pi}{2})$, we substitute $x$ values:
- When $x=-\frac{\pi}{2}$, $y=\frac{3}{4}\sin(-\frac{\pi}{2}+\frac{\pi}{2})=\frac{3}{4}\sin(0) = 0$.
- When $x = 0$, $y=\frac{3}{4}\sin(0+\frac{\pi}{2})=\frac{3}{4}\times1=\frac{3}{4}$.
- When $x=\frac{\pi}{2}$, $y=\frac{3}{4}\sin(\frac{\pi}{2}+\frac{\pi}{2})=\frac{3}{4}\sin(\pi)=0$.
- When $x=\pi$, $y=\frac{3}{4}\sin(\pi+\frac{\pi}{2})=\frac{3}{4}\sin(\frac{3\pi}{2})=-\frac{3}{4}$.
- When $x=\frac{3\pi}{2}$, $y=\frac{3}{4}\sin(\frac{3\pi}{2}+\frac{\pi}{2})=\frac{3}{4}\sin(2\pi)=0$.
Step4: Plot the points and draw the graph
Plot the points $(-\frac{\pi}{2},0),(0,\frac{3}{4}),(\frac{\pi}{2},0),(\pi,-\frac{3}{4}),(\frac{3\pi}{2},0)$ on the given coordinate axes and draw a smooth sine - wave passing through these points. The graph oscillates between $y = \frac{3}{4}$ and $y=-\frac{3}{4}$ with a period of $2\pi$ (since for $y = A\sin(Bx - C)+D$, the period $T=\frac{2\pi}{|B|}$ and here $B = 1$) and is shifted $\frac{\pi}{2}$ units to the left compared to the graph of $y=\sin(x)$.
The actual graph cannot be directly provided in text - only the steps to create it are given. The key is to plot the points calculated above and draw a smooth sine - curve with amplitude $\frac{3}{4}$ and phase - shift $-\frac{\pi}{2}$ on the given $x$ and $y$ axes.