graph the function f(x) = cos(\\frac{x}{2}).
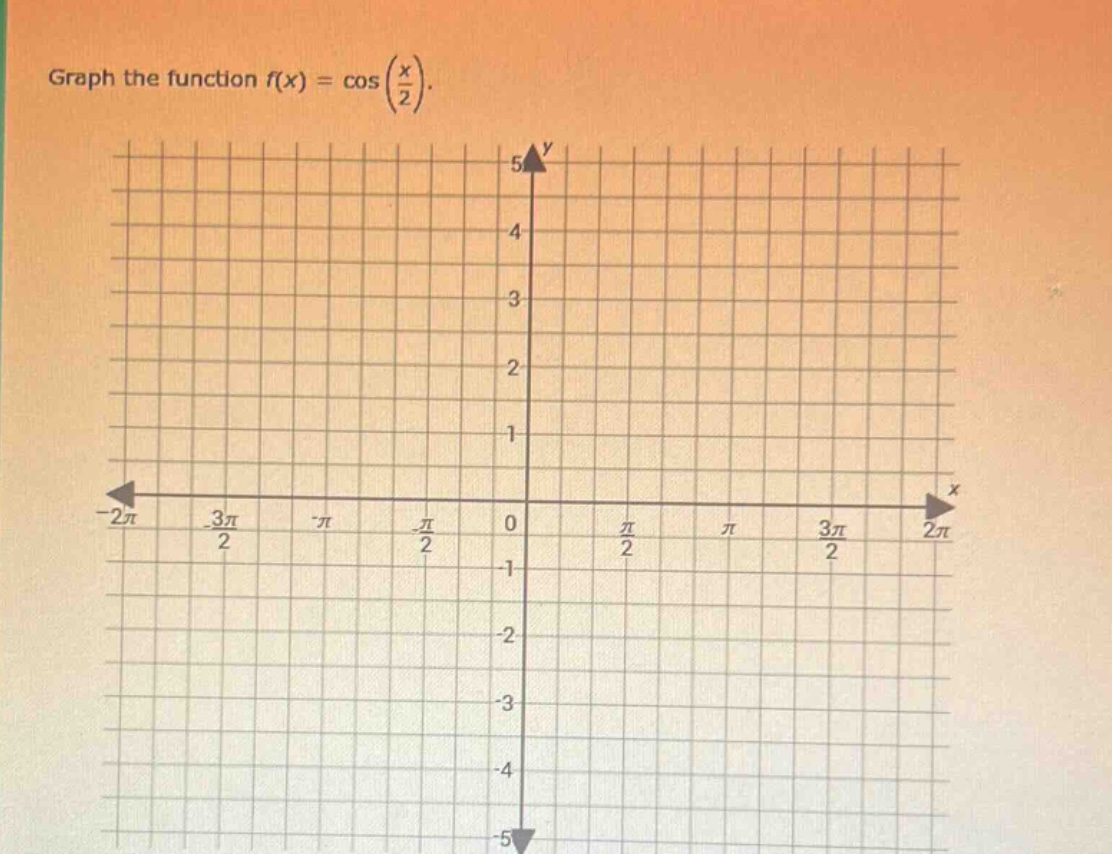
graph the function f(x) = cos(\\frac{x}{2}).
Answer
Answer:
To graph $y = \cos(\frac{x}{2})$, we can follow these steps to plot key - points and then draw the curve.
Explanation:
Step1: Recall the general form of a cosine function
The general form of a cosine function is $y = A\cos(Bx - C)+D$. For $y=\cos(\frac{x}{2})$, we have $A = 1$, $B=\frac{1}{2}$, $C = 0$, and $D = 0$. The amplitude $|A|=1$, and the period $T=\frac{2\pi}{|B|}$.
Step2: Calculate the period
Since $B=\frac{1}{2}$, the period $T=\frac{2\pi}{\frac{1}{2}}=4\pi$.
Step3: Find key - points
We know that for the basic cosine function $y = \cos(x)$, the key - points in one period $[0,2\pi]$ are $(0,1),(\frac{\pi}{2},0),(\pi,- 1),(\frac{3\pi}{2},0),(2\pi,1)$. For $y=\cos(\frac{x}{2})$, in the period $[0,4\pi]$:
- When $x = 0$, $y=\cos(0)=1$.
- When $x = \pi$, $y=\cos(\frac{\pi}{2})=0$.
- When $x = 2\pi$, $y=\cos(\pi)=-1$.
- When $x = 3\pi$, $y=\cos(\frac{3\pi}{2})=0$.
- When $x = 4\pi$, $y=\cos(2\pi)=1$.
Step4: Plot the points and draw the graph
Plot the points $(0,1),(\pi,0),(2\pi,-1),(3\pi,0),(4\pi,1)$ and their symmetric counterparts in the negative $x$ - direction on the given coordinate grid. Then, draw a smooth cosine - shaped curve passing through these points. The graph of $y = \cos(\frac{x}{2})$ oscillates between $y=-1$ and $y = 1$ with a period of $4\pi$.