graph each function.\n$f(x)=\frac{x - 3}{x - 2}$
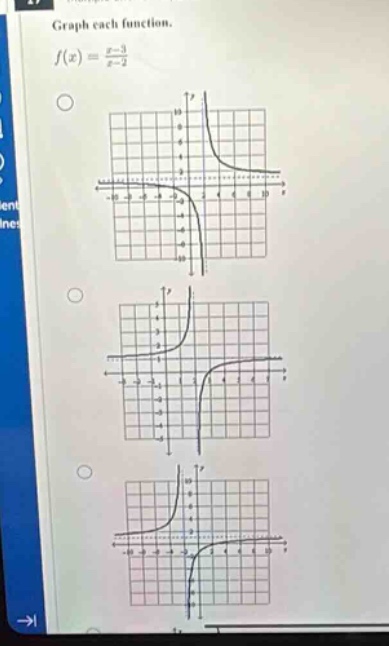
graph each function.\n$f(x)=\frac{x - 3}{x - 2}$
Answer
Explanation:
Step1: Identify vertical asymptote
Set the denominator equal to 0. So $x - 2=0$, then $x = 2$ is the vertical asymptote.
Step2: Identify horizontal asymptote
Since the degree of the numerator and denominator are the same (both degree 1), the horizontal asymptote is $y=\frac{1}{1}=1$ (the ratio of the leading - coefficients).
Step3: Find the x - intercept
Set $y = 0$, then $\frac{x - 3}{x - 2}=0$, so $x-3 = 0$ and $x = 3$ is the x - intercept.
Step4: Find the y - intercept
Set $x = 0$, then $y=\frac{0 - 3}{0 - 2}=\frac{3}{2}$ is the y - intercept.
Step5: Analyze the behavior
As $x\to2^{+}$, $\frac{x - 3}{x - 2}\to+\infty$; as $x\to2^{-}$, $\frac{x - 3}{x - 2}\to-\infty$; as $x\to+\infty$, $y\to1^{+}$; as $x\to-\infty$, $y\to1^{-}$. Based on these characteristics, the correct graph is the one with a vertical asymptote at $x = 2$, a horizontal asymptote at $y = 1$, an x - intercept at $x = 3$ and a y - intercept at $y=\frac{3}{2}$.
Answer:
The graph with vertical asymptote $x = 2$, horizontal asymptote $y = 1$, x - intercept at $x = 3$ and y - intercept at $y=\frac{3}{2}$ (usually the third graph among the options if numbered from top - to - bottom).