the graph of the function f is given below. arrange the following values in increasing order. use a, b, c…
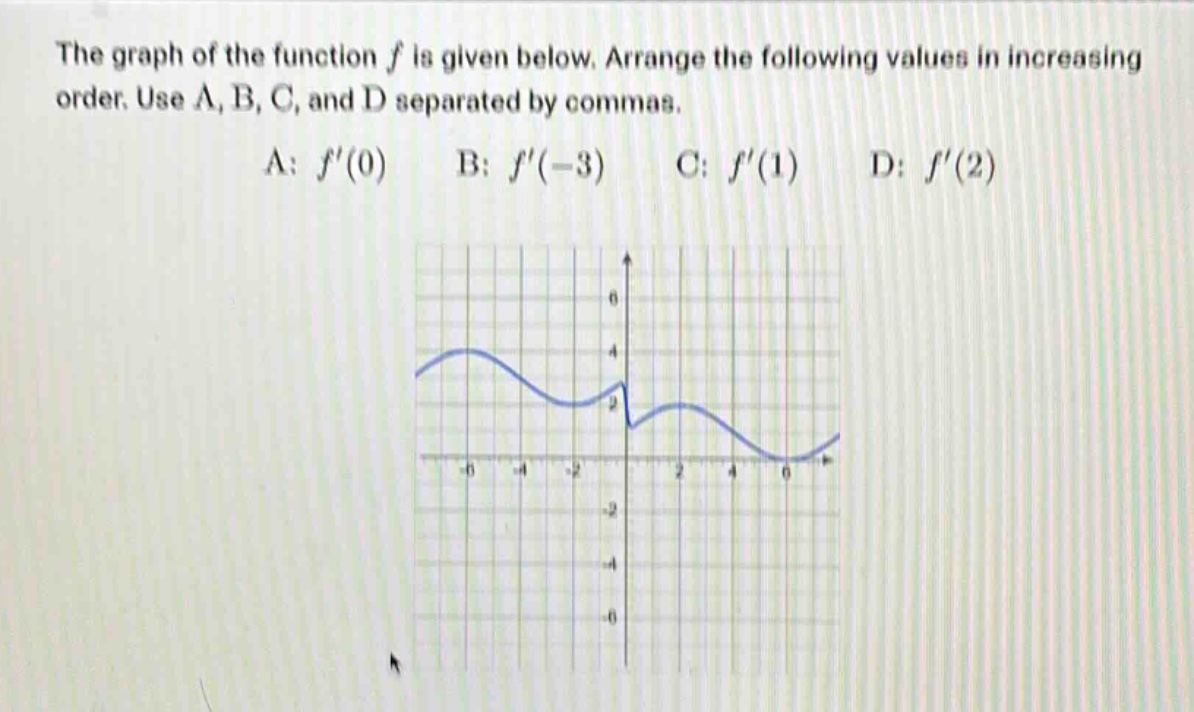
the graph of the function f is given below. arrange the following values in increasing order. use a, b, c, and d separated by commas. a: f(0) b: f(-3) c: f(1) d: f(2)
Answer
Explanation:
Step1: Recall derivative - slope relationship
The derivative $f^{\prime}(x)$ represents the slope of the tangent line to the graph of $y = f(x)$ at $x$.
Step2: Analyze slope at $x=-3$
At $x = - 3$, the function is increasing, so $f^{\prime}(-3)>0$. The tangent - line has a positive slope.
Step3: Analyze slope at $x = 0$
At $x = 0$, the function is decreasing, so $f^{\prime}(0)<0$. The tangent - line has a negative slope.
Step4: Analyze slope at $x = 1$
At $x = 1$, the function has a horizontal tangent, so $f^{\prime}(1)=0$.
Step5: Analyze slope at $x = 2$
At $x = 2$, the function is increasing, and the slope of the tangent line at $x = 2$ is steeper than the slope of the tangent line at $x=-3$. So $f^{\prime}(2)>f^{\prime}(-3)$.
Answer:
A,C,B,D