graph the function f(x)=x² - 1 over the interval 0, 2. partition the interval into four subintervals of…
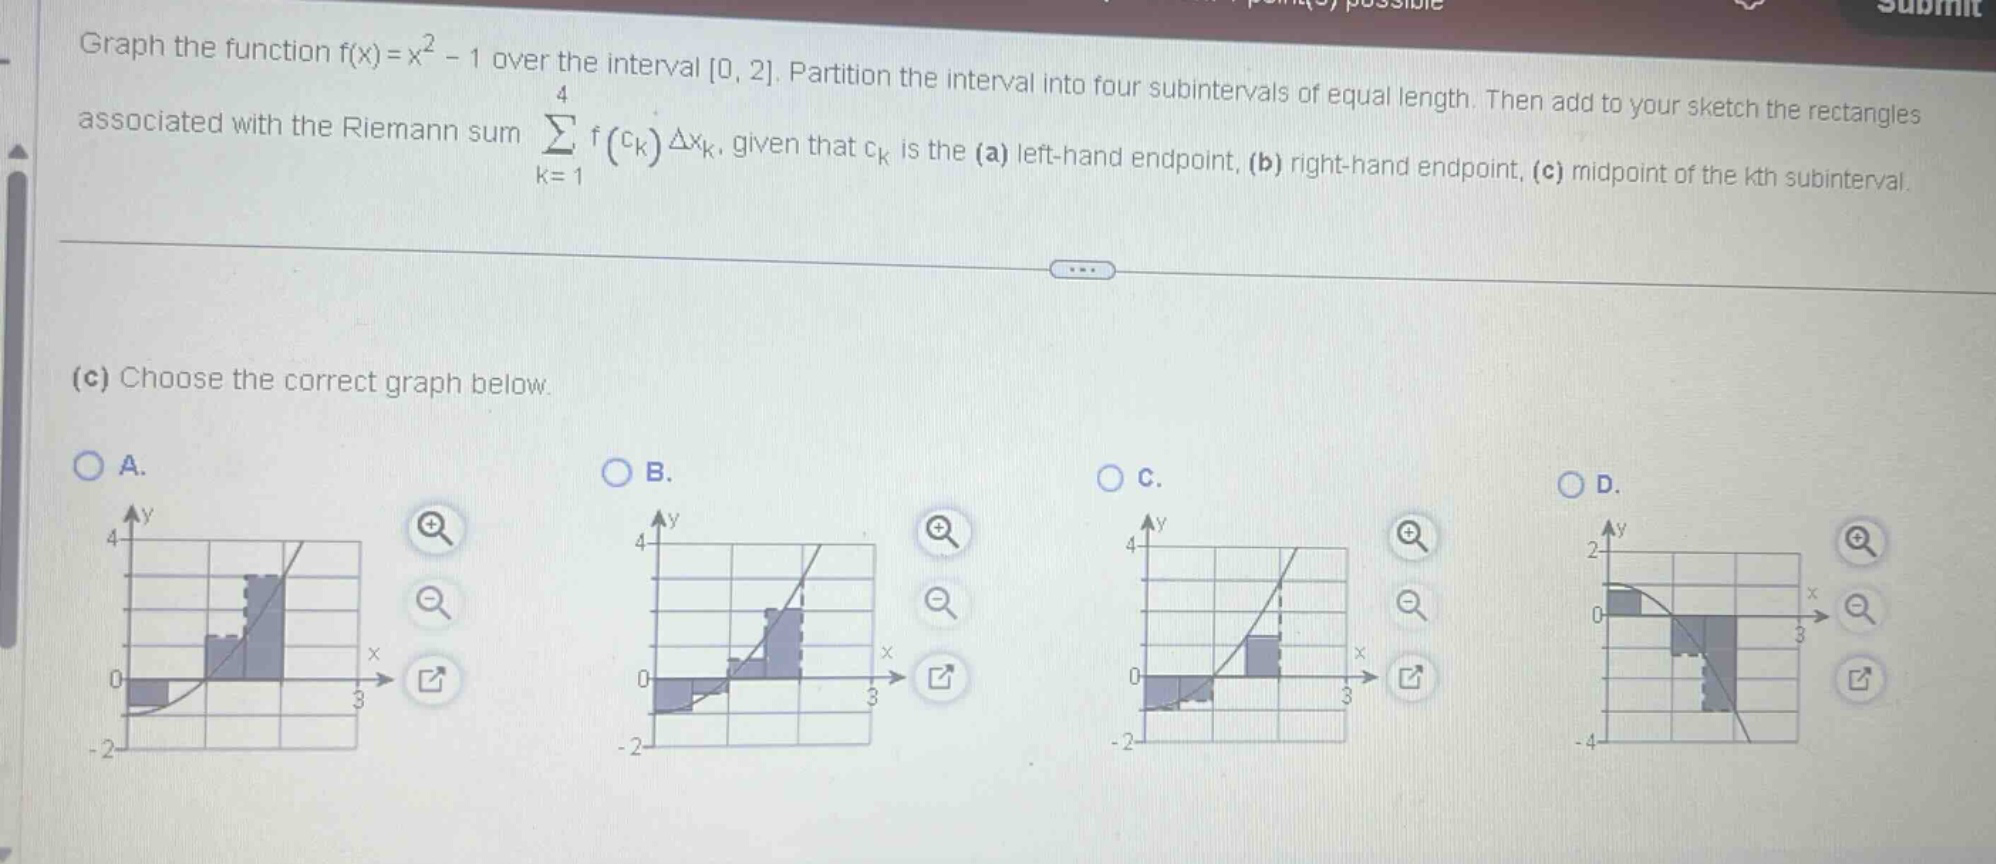
graph the function f(x)=x² - 1 over the interval 0, 2. partition the interval into four subintervals of equal length. then add to your sketch the rectangles associated with the riemann sum ∑ₖ₌₁⁴ f(cₖ)δxₖ, given that cₖ is the (a) left - hand endpoint, (b) right - hand endpoint, (c) midpoint of the kth subinterval. (c) choose the correct graph below. a. b. c. d.
Answer
Explanation:
Step1: Calculate sub - interval length
The interval is $[0,2]$ and $n = 4$. The length of each sub - interval $\Delta x=\frac{b - a}{n}=\frac{2-0}{4}=0.5$. The sub - intervals are $[0,0.5]$, $[0.5,1]$, $[1,1.5]$, $[1.5,2]$.
Step2: Find mid - points
The mid - points $c_1 = 0.25$, $c_2=0.75$, $c_3 = 1.25$, $c_4=1.75$.
Step3: Calculate function values at mid - points
$f(c_1)=(0.25)^2 - 1=- 0.9375$, $f(c_2)=(0.75)^2 - 1=-0.4375$, $f(c_3)=(1.25)^2 - 1 = 0.5625$, $f(c_4)=(1.75)^2 - 1=2.0625$.
Step4: Calculate Riemann sum
The Riemann sum $\sum_{k = 1}^{4}f(c_k)\Delta x=\Delta x\left[f(c_1)+f(c_2)+f(c_3)+f(c_4)\right]=0.5(-0.9375 - 0.4375+0.5625 + 2.0625)=0.625$. For the graph of the mid - point Riemann sum rectangles: The height of the rectangles is determined by the function value at the mid - point of each sub - interval. The base of each rectangle is $\Delta x = 0.5$. The correct graph for the mid - point Riemann sum has rectangles where the mid - point of the top of each rectangle touches the curve $y=x^{2}-1$.
Answer:
(Without seeing the actual visual details of the graphs A, B, C, D precisely, we can't give a letter - based answer. But the correct graph should have rectangles with heights corresponding to the function values at the mid - points of the sub - intervals as calculated above and bases of length 0.5 on the sub - intervals $[0,0.5]$, $[0.5,1]$, $[1,1.5]$, $[1.5,2]$)