graph the function over a one - period interval. y = tan 7x which graph below shows one period of the…
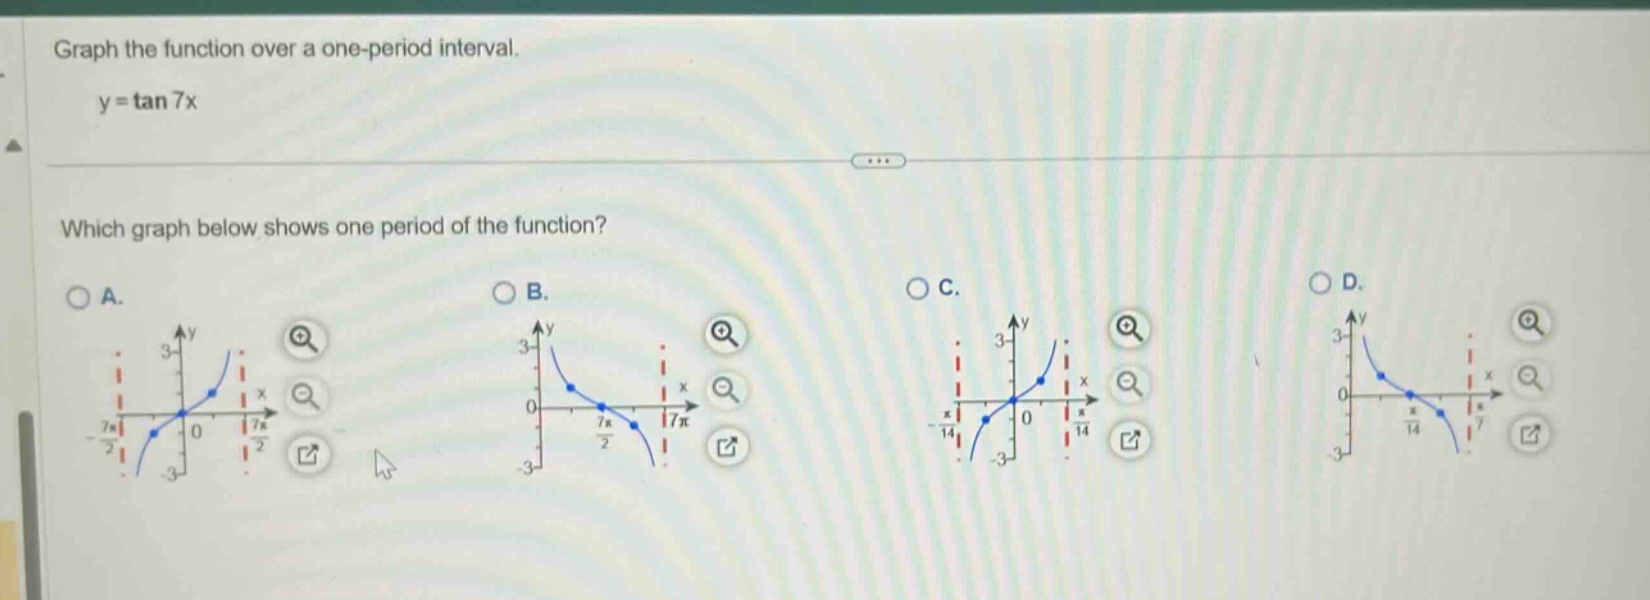
graph the function over a one - period interval. y = tan 7x which graph below shows one period of the function? a. b. c. d.
Answer
Explanation:
Step1: Recall period formula for tangent
The period of $y = A\tan(Bx - C)+D$ is $\frac{\pi}{|B|}$. For $y=\tan(7x)$, $B = 7$, so the period is $\frac{\pi}{7}$.
Step2: Find vertical - asymptotes
The vertical asymptotes of $y = \tan(x)$ occur at $x=(n+\frac{1}{2})\pi,n\in\mathbb{Z}$. For $y=\tan(7x)$, we set $7x=(n + \frac{1}{2})\pi$, then $x=\frac{(2n + 1)\pi}{14},n\in\mathbb{Z}$. For one - period interval, when $n = 0$, $x=-\frac{\pi}{14}$ and when $n = 1$, $x=\frac{\pi}{14}$.
Step3: Analyze the behavior of the tangent function
The tangent function $y = \tan(x)$ passes through the origin $(0,0)$. For $y=\tan(7x)$, when $x = 0$, $y=\tan(0)=0$. And the tangent function is an increasing function on each of its period intervals.
Answer:
C.