the graph of a function g(x) is shown. 32. on what interval of x - values is the function g(x) increasing? a…
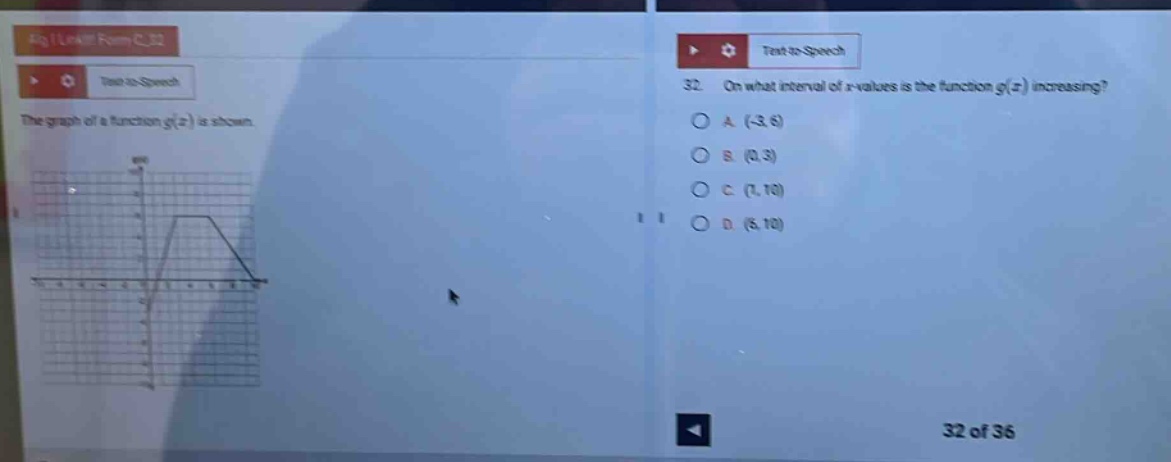
the graph of a function g(x) is shown. 32. on what interval of x - values is the function g(x) increasing? a (-3,6) b (0,3) c (1,10) d (5,10) 32 of 36
Answer
Explanation:
Step1: Recall increasing - function property
A function is increasing when its graph goes up as we move from left to right.
Step2: Analyze the given graph
Looking at the graph of (y = g(x)), we can see that the function is going up in the interval ((0,3)). In the interval ((- 3,0)) it is decreasing, in ((3,5)) it is constant and in ((5,10)) it is decreasing.
Answer:
B. ((0,3))