the graph of a function is shown below. on which interval is the function decreasing and non - linear?
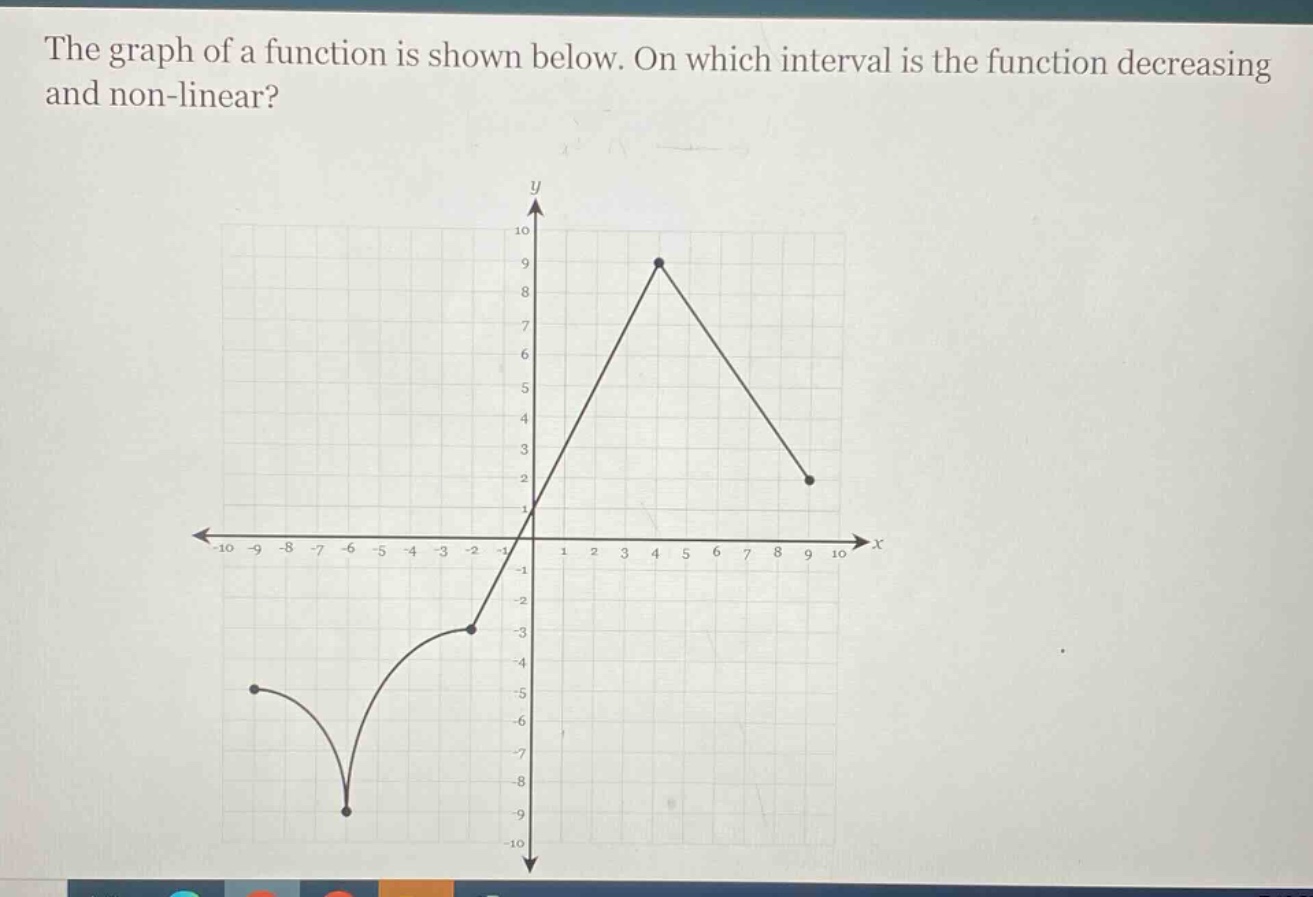
the graph of a function is shown below. on which interval is the function decreasing and non - linear?
Answer
Explanation:
Step1: Recall function - decreasing and non - linear criteria
A function is decreasing when as (x) increases, (y) decreases. A non - linear function is not a straight line.
Step2: Analyze the graph
In the given graph, in the interval ((4,9)), as (x) moves from (4) to (9), the (y) - values decrease from (9) to (2). Also, the part of the graph in this interval is not a straight line.
Answer:
((4,9))