the graph of a function is shown below. on which interval is the function decreasing and non - linear…
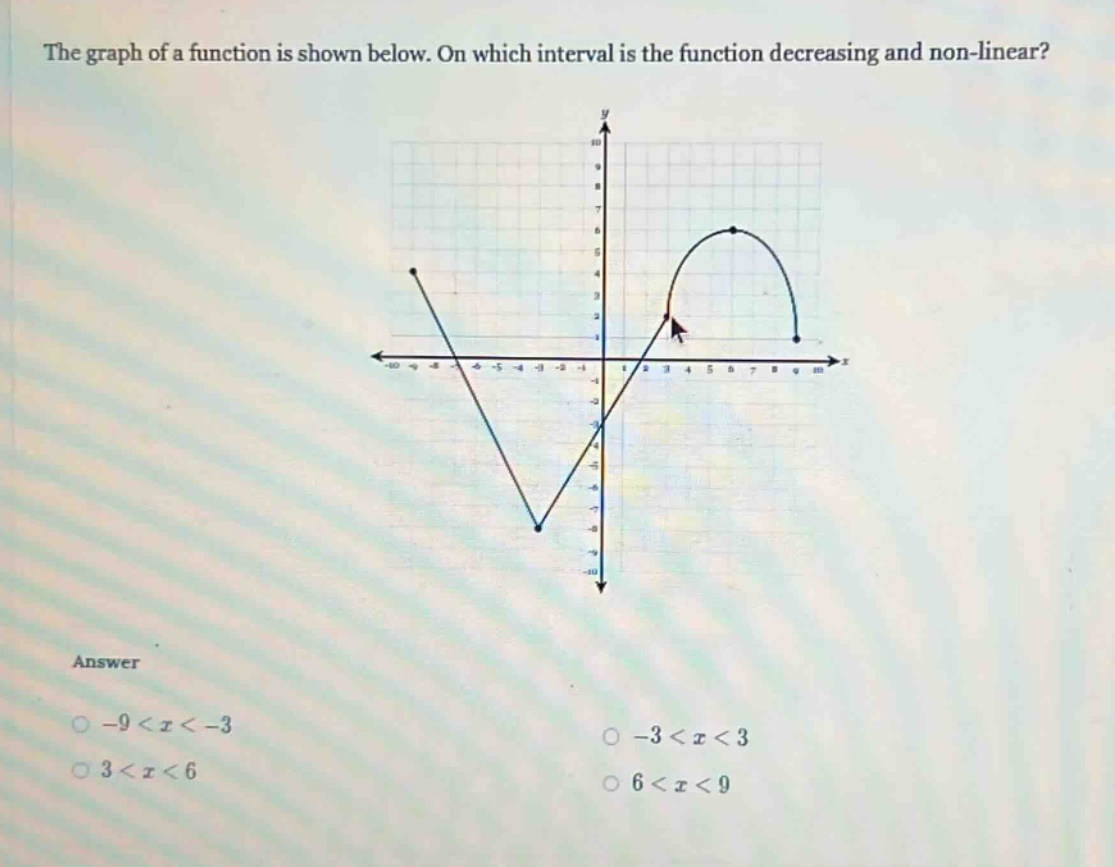
the graph of a function is shown below. on which interval is the function decreasing and non - linear? answer -9<x<-3 -3<x<3 3<x<6 6<x<9
Answer
Explanation:
Step1: Recall function - decreasing and non - linear
A function is decreasing when as (x) increases, (y) decreases. A non - linear function does not have a straight - line graph.
Step2: Analyze the interval (-9 < x < - 3)
The function in the interval (-9 < x < - 3) is decreasing but it is linear (a straight - line segment).
Step3: Analyze the interval (-3 < x < 3)
The function in the interval (-3 < x < 3) is increasing.
Step4: Analyze the interval (3 < x < 6)
The function in the interval (3 < x < 6) is increasing.
Step5: Analyze the interval (6 < x < 9)
The function in the interval (6 < x < 9) is decreasing and the graph is a curve (non - linear).
Answer:
(6 < x < 9)