the graph of the the function f(x) is shown at the right. a. make a table of values for f(x) and f(x + 5)…
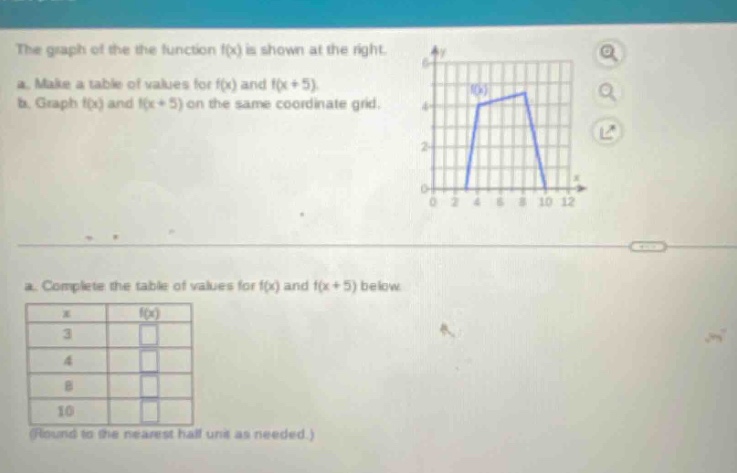
the graph of the the function f(x) is shown at the right. a. make a table of values for f(x) and f(x + 5). b. graph f(x) and f(x + 5) on the same coordinate grid. a. complete the table of values for f(x) and f(x + 5) below. x f(x) 3 4 8 10 (round to the nearest half unit as needed.)
Answer
Explanation:
Step1: Read values of f(x) from graph
For (x = 3), from the graph, (f(3)=0). For (x = 4), (f(4) = 4). For (x=8), (f(8)=4). For (x = 10), (f(10)=0).
Step2: Find values of f(x + 5)
To find (f(x+5)), we shift the (x) - values. When (x = 3), (x+5=8), so (f(3 + 5)=f(8)=4). When (x = 4), (x + 5=9), from the graph (f(9)=4). When (x=8), (x + 5 = 13), (f(13)) is not in the domain of the given graph. When (x = 10), (x+5=15), (f(15)) is not in the domain of the given graph. We can only calculate for the values of (x) such that (x + 5) is in the domain of the graph.
| (x) | (f(x)) | (f(x + 5)) |
|---|---|---|
| (3) | (0) | (4) |
| (4) | (4) | (4) |
| (8) | (4) | - |
| (10) | (0) | - |
Answer:
| (x) | (f(x)) | (f(x + 5)) |
|---|---|---|
| (3) | (0) | (4) |
| (4) | (4) | (4) |
| (8) | (4) | - |
| (10) | (0) | - |